一、OpenSSL及证书服务常用系统监控命令
目标:
本案例要求练习常用的系统监控命令完成以下任务:
- 使用vmstat命令监控内存及磁盘I/O信息
- 使用iostat命令监控CPU处理器及磁盘的I/O信息
- 使用sar命令监控系统最近的CPU/内存等活动
步骤:
步骤一:使用vmstat命令监控内存及磁盘I/O信息
1)报告内存、交换分区、CPU等活动信息,每2秒更新一次数据
[root@svr7 ~]# vmstat 2
procs -----------memory---------- ---swap-- -----io---- -system-- ------cpu-----
r b swpd free buff cache si so bi bo in cs us sy id wa st
2 0 0 1447960 1204 331260 0 0 422 9 59 153 1 1 98 0 0
0 0 0 1447944 1204 331260 0 0 0 0 9 12 0 0 100 0 0
0 0 0 1447944 1204 331260 0 0 0 0 9 12 0
.. ..
2)报告一次磁盘的I/O信息
[root@svr7 ~]# vmstat -d
disk- ------------reads------------ ------------writes----------- -----IO------
total merged sectors ms total merged sectors ms cur sec
vda 7863 12 576137 2560 1427 25 12085 6142 0 3
sr0 11 0 88 3 0 0 0 0 0 0
dm-0 6529 0 562281 2503 356 0 7989 6480 0 3
dm-1 141 0 2536 7 0 0 0 0 0 0
3)报告一次指定分区的I/O信息
[root@svr7 ~]# vmstat -p /dev/vda1
vda1 reads read sectors writes requested writes
1010 8792 1025 4096
步骤二:使用iostat命令监控CPU处理器及磁盘的I/O信息
1)报告一次CPU和磁盘I/O信息
[root@svr7 ~]# iostat
Linux 3.10.0-327.el7.x86_64 (svr7.tedu.cn) 2017年05月03日 _x86_64_ (1 CPU)
avg-cpu: %user %nice %system %iowait %steal %idle
0.77 0.00 0.71 0.05 0.00 98.47
Device: tps kB_read/s kB_wrtn/s kB_read kB_wrtn
vda 9.85 304.60 6.45 288160 6103
scd0 0.01 0.05 0.00 44 0
dm-0 7.30 297.28 4.29 281232 4055
dm-1 0.15 1.34 0.00 1268 0
2)报告CPU和磁盘I/O信息,每2秒钟采样一次
[root@svr7 ~]# iostat 2
Linux 3.10.0-327.el7.x86_64 (svr7.tedu.cn) 2017年05月03日 _x86_64_ (1 CPU)
avg-cpu: %user %nice %system %iowait %steal %idle
0.66 0.00 0.61 0.05 0.00 98.68
Device: tps kB_read/s kB_wrtn/s kB_read kB_wrtn
vda 8.42 259.61 5.62 288168 6235
scd0 0.01 0.04 0.00 44 0
dm-0 6.25 253.37 3.77 281240 4187
dm-1 0.13 1.14 0.00 1268 0
avg-cpu: %user %nice %system %iowait %steal %idle
0.00 0.00 0.00 0.00 0.00 100.00
Device: tps kB_read/s kB_wrtn/s kB_read kB_wrtn
vda 0.00 0.00 0.00 0 0
scd0 0.00 0.00 0.00 0 0
dm-0 0.00 0.00 0.00 0 0
dm-1 0.00 0.00 0.00 0 0
.. ..
步骤三:使用sar命令监控系统最近的CPU/内存等活动
1)查看一次最近的系统活动完整(-A)报告
[root@svr7 ~]# sar -A
Linux 3.10.0-327.el7.x86_64 (svr7.tedu.cn) 2017年05月03日 _x86_64_ (1 CPU)
11时20分01秒
CPU %usr %nice %sys %iowait %steal %irq %soft %guest %gnice %idle
11时30分01秒 all 0.17 0.00 0.11 0.01 0.00 0.00 0.00 0.00 0.00 99.71
11时30分01秒 0 0.17 0.00 0.11 0.01 0.00 0.00 0.00 0.00 0.00 99.71
平均时间: all 0.17 0.00 0.11 0.01 0.00 0.00 0.00 0.00 0.00 99.71
平均时间: 0 0.17 0.00 0.11 0.01 0.00 0.00 0.00 0.00 0.00 99.71
11时20分01秒 proc/s cswch/s
11时30分01秒 0.39 23.27
平均时间: 0.39 23.27
11时20分01秒 pswpin/s pswpout/s
11时30分01秒 0.00 0.00
平均时间: 0.00 0.00
11时20分01秒 pgpgin/s pgpgout/s fault/s majflt/s pgfree/s pgscank/s pgscand/s pgsteal/s %vmeff
11时30分01秒 6.30 0.35 165.40 0.03 133.94 0.00 0.00 0.00 0.00
平均时间: 6.30 0.35 165.40 0.03 133.94 0.00 0.00 0.00 0.00
11时20分01秒 tps rtps wtps bread/s bwrtn/s
11时30分01秒 0.38 0.27 0.11 12.59 0.70
平均时间: 0.38 0.27 0.11 12.59 0.70
11时20分01秒 frmpg/s bufpg/s campg/s
11时30分01秒 -4.90 0.00 1.37
平均时间: -4.90 0.00 1.37
11时20分01秒 kbmemfree kbmemused %memused kbbuffers kbcached kbcommit %commit kbactive kbinact kbdirty
11时30分01秒 1444844 604264 29.49 1204 277020 1547884 37.33 249044 241260 0
平均时间: 1444844 604264 29.49 1204 277020 1547884 37.33 249044 241260 0
11时20分01秒 kbswpfree kbswpused %swpused kbswpcad %swpcad
11时30分01秒 2097148 0 0.00 0 0.00
平均时间: 2097148 0 0.00 0 0.00
.. ..
2)报告CPU活动信息,以5秒为间隔再采用3次
[root@svr7 ~]# sar -u 5 3
Linux 3.10.0-327.el7.x86_64 (svr7.tedu.cn) 2017年05月03日 _x86_64_ (1 CPU)
11时44分20秒 CPU %user %nice %system %iowait %steal %idle
11时44分25秒 all 0.00 0.00 0.00 0.00 0.00 100.00
11时44分30秒 all 0.00 0.00 0.00 0.00 0.00 100.00
11时44分35秒 all 0.00 0.00 0.00 0.00 0.00 100.00
平均时间: all 0.00 0.00 0.00 0.00 0.00 100.00
3)报告最近的磁盘I/O信息
[root@svr7 ~]# sar -b
Linux 3.10.0-327.el7.x86_64 (svr7.tedu.cn) 2017年05月03日 _x86_64_ (1 CPU)
.. ..
11时20分01秒 tps rtps wtps bread/s bwrtn/s
11时30分01秒 0.38 0.27 0.11 12.59 0.70
11时40分01秒 0.25 0.13 0.12 15.62 0.93
平均时间: 0.31 0.20 0.11 14.11 0.81
二、搭建nagios监控服务器
目标:
本案例要求搭建一台nagios监控服务器,确认Web界面可用:
- 安装nagios、nagios-plugins软件包
- 配置及访问web界面,将管理用户/密码均设为 nagiosadmin
步骤:
步骤一:安装前的准备工作
1)安装网站平台环境、编译工具
[root@svr7 ~]# yum -y install httpd php gd
[root@svr7 ~]# yum -y install gcc glibc glibc-common
2)创建运行账号
[root@svr7 ~]# groupadd nagcmd
[root@svr7 ~]# useradd -G nagcmd nagios
[root@svr7 ~]# gpasswd -a apache nagcmd
步骤二:编译安装nagios及nagios-plugins
1)安装nagios
[root@svr7 ~]# tar xf ~/nagios-4.3.1.tar.gz -C /usr/src/
[root@svr7 ~]# cd /usr/src/nagios-4.3.1/
[root@svr7 nagios-4.3.1]# ./configure --with-command-group=nagcmd
[root@svr7 nagios-4.3.1]# make all //编译
[root@svr7 nagios-4.3.1]# make install //安装程序
[root@svr7 nagios-4.3.1]# make install-init //安装控制脚本
[root@svr7 nagios-4.3.1]# make install-config //安装配置
[root@svr7 nagios-4.3.1]# make install-commandmode //调权限
[root@svr7 nagios-4.3.1]# make install-webconf //部署网站配置
[root@svr7 nagios-4.3.1]# chkconfig --add nagios //加载服务配置
2)安装nagios-plugins
[root@svr7 ~]# tar xf ~/nagios-plugins-2.1.4.tar.gz -C /usr/src/
[root@svr7 ~]# cd /usr/src/nagios-plugins-2.1.4/
[root@svr7 nagios-plugins-2.1.4]# ./configure --with-nagios-user=nagios --with-nagios-group=nagcmd
[root@svr7 nagios-plugins-2.1.4]# make
[root@svr7 nagios-plugins-2.1.4]# make install
步骤三:启用及访问Nagios平台
1)为Nagios平台添加Web管理用户
[root@svr7 ~]# htpasswd -c /usr/local/nagios/etc/htpasswd.users nagiosadmin //建Web管理用户
2)启用nagios、httpd服务
[root@svr7 ~]# systemctl restart nagios //启用nagios
[root@svr7 ~]# systemctl restart httpd //启用Web
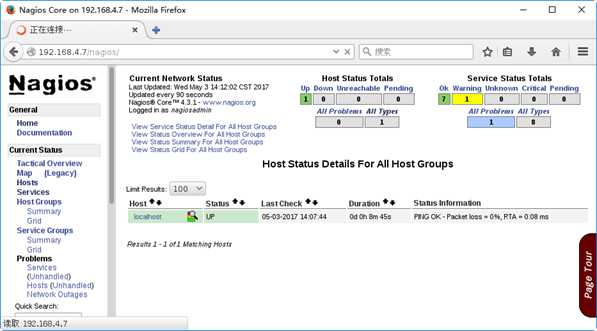
3)访问nagios网页界面
firefox http://服务器地址/nagios/,如下图所示。
三、配置文件及插件使用
目标:
本案例要求熟悉nagios的常用插件程序,完成以下任务:
- 使用插件 check_http 检测本机的Web端口
- 使用插件 check_tcp 检测本机的FTP服务端口
- 使用插件 check_disk 检测本机根分区使用率:可用空间低于80%报 WARNING,可用空间低于60%报 CRITICAL
步骤:
步骤一:使用插件 check_http 检测本机的Web端口
1)关闭本机的httpd服务,执行check_http检查
[root@svr7 ~]# /usr/local/nagios/libexec/check_http -H localhost -p 80connect to address localhost and port 80: 拒绝连接
HTTP CRITICAL - Unable to open TCP socket
2)启动本机的httpd服务,并建立默认首页index.html
[root@svr7 ~]# vim /var/www/html/index.html
Default site.
[root@svr7 ~]# systemctl restart httpd
3)再次执行check_http检查
[root@svr7 ~]# /usr/local/nagios/libexec/check_http -H localhost -p 80
HTTP OK: HTTP/1.1 200 OK - 302 bytes in 0.006 second response time |time=0.006236s;;;0.000000 size=302B;;;0
步骤二:使用插件check_tcp检测本机的FTP服务端口
1)未启动FTP服务时,执行check_ftp检查
[root@svr7 ~]# /usr/local/nagios/libexec/check_ftp -H localhost -p 21
connect to address localhost and port 21: 拒绝连接
2)安装及启动vsftpd服务以后,再次执行check_ftp检查
[root@svr7 ~]# yum -y install vsftpd
[root@svr7 ~]# systemctl restart vsftpd
[root@svr7 ~]# /usr/local/nagios/libexec/check_ftp -H localhost -p 21
FTP OK - 0.002 second response time on localhost port 21 [220 (vsFTPd 3.0.2)]|time=0.002164s;;;0.000000;10.000000
步骤三:使用插件check_disk检测本机/boot分区使用率
1)查看/boot目录所在分区的使用率
[root@svr7 ~]# df -hT /boot
文件系统 类型 容量 已用 可用 已用% 挂载点
/dev/vda1 xfs 497M 140M 358M 29% /boot
2)使用check_disk检查
可用空间低于80%报 WARNING,可用空间低于60%报 CRITICAL
[root@svr7 ~]# /usr/local/nagios/libexec/check_disk -w 80% -c 60% -p /boot
DISK WARNING - free space: /boot 357 MB (71% inode=99%);| /boot=139MB;99;198;0;496
3)查看实际使用率情况,调低阈值再次check_disk测试
[root@svr7 ~]# /usr/local/nagios/libexec/check_disk -w 60% -c 40% -p /boot
DISK OK - free space: /boot 357 MB (71% inode=99%);| /boot=139MB;297;198;0;496
四、监控远程主机的公有数据
目标:
本案例要求在Nagios平台上添加对远程主机pc207的监控,主要包括下列服务:
- ping连通状态
- Web服务
- FTP服务
- SSH服务
步骤:
步骤一:准备被监控主机pc207
1)正确配置IP地址,确保与主机svr7可相互ping通
[root@pc207 ~]# ping 192.168.4.7
PING 192.168.4.7 (192.168.4.7) 56(84) bytes of data.
64 bytes from 192.168.4.7: icmp_seq=1 ttl=64 time=0.621 ms
64 bytes from 192.168.4.7: icmp_seq=2 ttl=64 time=0.427 ms
.. ..
2)确保已启用httpd、vsftpd、sshd服务,并关闭防火墙服务firewalld
[root@pc207 ~]# yum -y install httpd vsftpd
.. ..
[root@pc207 ~]# systemctl restart httpd vsftpd sshd
[root@pc207 ~]# systemctl disable firewalld --now
步骤二:配置监控服务器svr7
1)新建监控配置pc207.cfg,定义监控目标(主机、服务)
[root@svr7 ~]# vim /usr/local/nagios/etc/objects/pc207.cfg
define host {
use linux-server
host_name pc207
address 172.25.0.10
}
define service {
use local-service
host_name pc207
service_description PING
check_command check_ping!100.0,20%!500.0,60%
}
define service {
use local-service
host_name pc207
service_description Web Server
check_command check_http
}
define service {
use local-service
host_name pc207
service_description FTP Server
check_command check_ftp
}
define service {
use local-service
host_name pc207
service_description SSH Server
check_command check_ssh
}
2)调整nagios.cfg,启用pc207.cfg监控配置
[root@svr7 ~]# vim /usr/local/nagios/etc/nagios.cfg
.. ..
cfg_file=/usr/local/nagios/etc/objects/pc207.cfg
3)重启nagios服务
[root@svr7 ~]# systemctl restart nagios
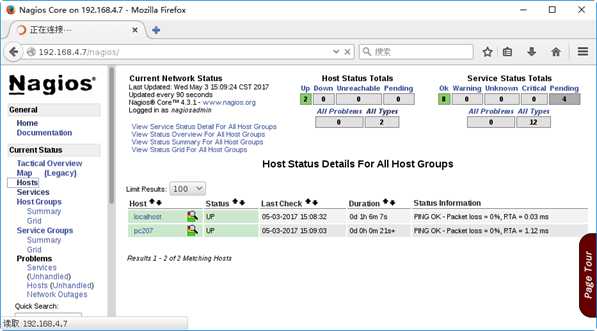
步骤三:刷新Nagios管理界面,确认新增主机pc207的监控结果
1)确认Hosts下新增的主机,如下图所示
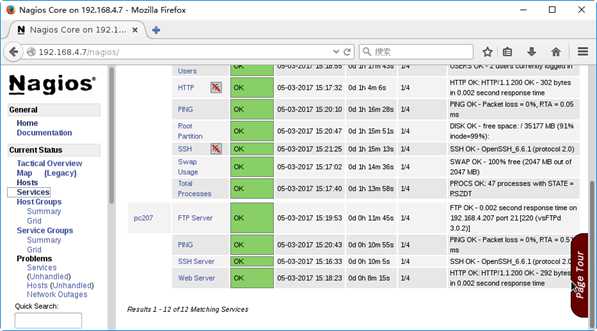
2)确认Services下新增的服务信息,如下图所示
五、监控远程主机的私有数据
目标:
本案例要求在Nagios服务器上添加对远程主机pc207上私有数据的监控,完成以下监控项目:
- 运行的进程数
- 登录的用户数
- CPU负载
- 根分区使用量
方案:
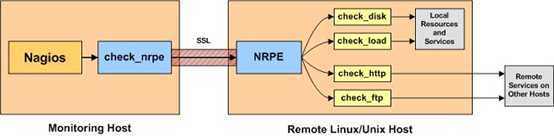
Linux主机的内存信息、磁盘I/O信息等私有数据默认不对外提供,若希望从Nagios监控平台获取远程主机的私有数据,需要在被监控主机上配置启用nrpe服务。
主要工作结构:Nagios监控端(check_nrpe插件) ==> 被监控端(nrpe服务),如下图所示。
步骤:
步骤一:准备被监控主机pc207
1)安装nagios-plugins插件
[root@pc207 ~]# yum -y install gcc glibc glibc-common
[root@pc207 ~]# groupadd nagcmd
[root@pc207 ~]# useradd -G nagcmd nagios
[root@pc207 ~]# tar xf ~/nagios-plugins-2.1.4.tar.gz -C /usr/src/
[root@pc207 ~]# cd /usr/src/nagios-plugins-2.1.4/
[root@pc207 nagios-plugins-2.1.4]# ./configure --with-nagios-user=nagios --with-nagios-group=nagcmd
[root@pc207 nagios-plugins-2.1.4]# make
[root@pc207 nagios-plugins-2.1.4]# make install
2)安装nrpe
[root@pc207 ~]# yum -y install openssl-devel //安装SSL头文件
[root@pc207 ~]# tar xf nrpe-3.1.0.tar.gz -C /usr/src/
[root@pc207 ~]# cd /usr/src/nrpe-3.1.0/
[root@pc207 nrpe-3.1.0]# ./configure
[root@pc207 nrpe-3.1.0]# make all //编译所有
[root@pc207 nrpe-3.1.0]# make install //安装nrpe及插件
[root@pc207 nrpe-3.1.0]# make install-init //安装服务
[root@pc207 nrpe-3.1.0]# make install-config //安装配置文件
3)定义nrpe监控命令
[root@pc207 ~]# vim /usr/local/nagios/etc/nrpe.cfg
.. ..
allowed_hosts=172.25.0.0/24,127.0.0.1,::1 //允许哪些主机
command[check_users]=/usr/local/nagios/libexec/check_users -w 5 -c 10
command[check_load]=/usr/local/nagios/libexec/check_load -w 15,10,5 -c 30,25,20
command[check_rootdir]=/usr/local/nagios/libexec/check_disk -w 20% -c 10% -p /
command[check_zombie_procs]=/usr/local/nagios/libexec/check_procs -w 150 -c 200 -s Z
command[check_total_procs]=/usr/local/nagios/libexec/check_procs -w 150 -c 200
4)启用nrpe服务并测试
[root@pc207 ~]# systemctl restart nrpe
[root@pc207 ~]# systemctl enable nrpe
.. ..
[root@pc207 ~]# /usr/local/nagios/libexec/check_nrpe -H localhost
NRPE v3.1.0-rc1 //测试连本机nrpe服务
步骤二:配置Nagios监控服务器
1)为Nagios安装check_nrpe插件
[root@svr7 ~]# yum -y install openssl-devel
[root@svr7 ~]# tar xf nrpe-3.1.0.tar.gz -C /usr/src/
[root@svr7 ~]# cd /usr/src/nrpe-3.1.0/
[root@svr7 nrpe-3.1.0]# ./configure
[root@svr7 nrpe-3.1.0]# make all //编译所有
[root@svr7 nrpe-3.1.0]# make install-plugin //安装check_nrpe插件
2)测试连远程的nrpe服务,并添加远程nrpe监控指令
[root@svr7 ~]# /usr/local/nagios/libexec/check_nrpe -H 172.25.0.10
NRPE v3.1.0-rc1 //测试连远程 的nrpe服务
[root@svr7 ~]# vim /usr/local/nagios/etc/objects/commands.cfg
.. ..
define command{
command_name check_nrpe
command_line $USER1$/check_nrpe -H $HOSTADDRESS$ -c $ARG1$
//-c 要求对方执行的命令
}
3)修改监控目标配置pc207.cfg,添加对远程主机pc207私有数据的获取
[root@svr7 ~]# vim /usr/local/nagios/etc/objects/pc207.cfg
.. ..
define service {
use local-service
host_name pc207
service_description NRPE-Total Procs
check_command check_nrpe!check_total_procs
}
define service {
use local-service
host_name pc207
service_description NRPE-Users
check_command check_nrpe!check_users
}
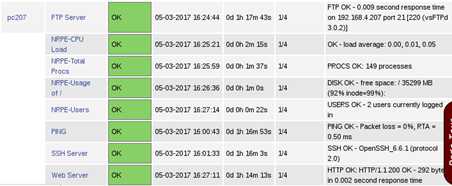
步骤三:刷新Nagios管理界面,确认主机pc207的私有数据监控结果
确认pc207主机及服务监控结果,如下图所示。