mysql的日志分为错误日志、二进制日志、慢查询日志、查询日志
1.错误日志
可以通过以下命令,来查看错误日志的文件: show variables like ‘log_error‘;
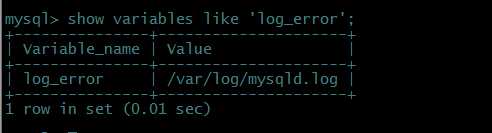
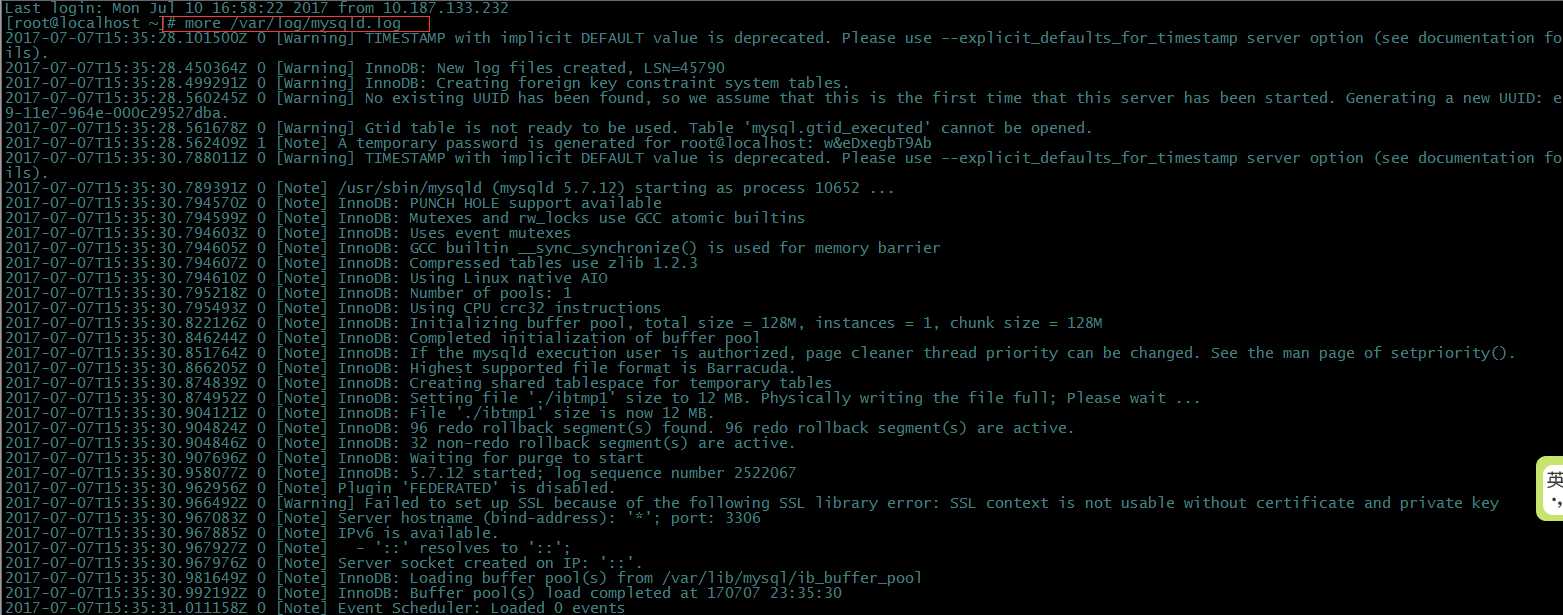
通过上面的命令可以定位到错误日志位置,然后通过查看错误日志文档来分析问题
2.慢查询日志
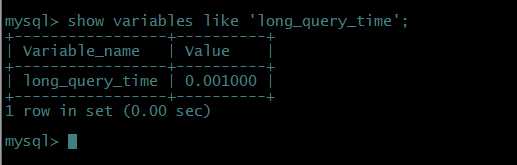
所谓的慢查询日志就是用来记录在mysql中运行速度缓慢的执行语句,什么样的语句能算是慢语句,是通过long_query_time这个阈值来设定的,默认为10,可以用命令来查看下:show variables like ‘long_query_time‘;
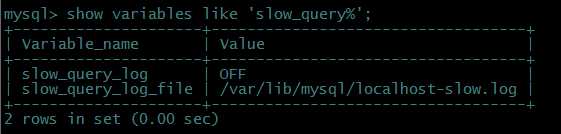
默认情况下,mysql并不启动慢sql日志,需要手动设置,查看慢sql日志是否启动以及日志位置用:show variables like ‘slow_query%‘;
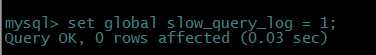
开启慢查询:set global slow_query_log = 1;
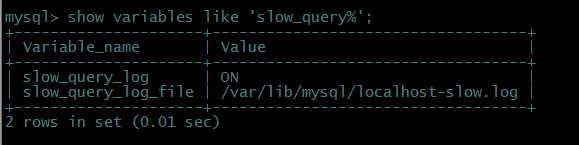
查看是否启动:show variables like ‘slow_query%‘;
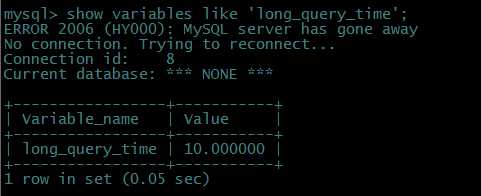
修改慢查询阈值:set global long_query_time = 0.001;
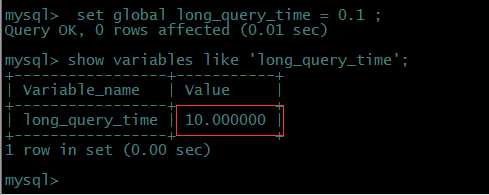
修改完后查看,如上图,发现还是默认值10,并不是设置的值0.001,这是因为设置完全局变量后,在当前窗口是不生效的,需要退出mysql重新连接或者新开一个窗口查看设置的值: