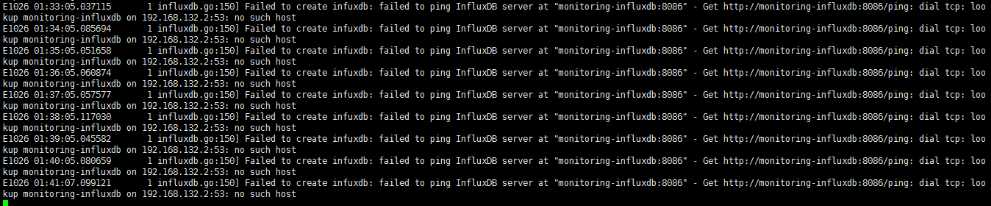
依赖于kubenets dns服务
地址:https://note.youdao.com/web/#/file/WEB42cf75c02ae113136ff664f3f137cb67/note/WEB0eec19f3667471969b3354b7128fda9c/
图形化展示度量指标的实现需要集成k8s的另外一个Addons组件: Heapster 。
Heapster原生支持K8s(v1.0.6及以后版本)和 CoreOS ,并且支持多种存储后端,比如: InfluxDB 、 ElasticSearch 、 Kafka 。
镜像地址:
index.tenxcloud.com/jimmy/heapster-amd64:v1.3.0-beta.1
index.tenxcloud.com/jimmy/heapster-influxdb-amd64:v1.1.1
index.tenxcloud.com/jimmy/heapster-grafana-amd64:v4.0.2
安装Heapster
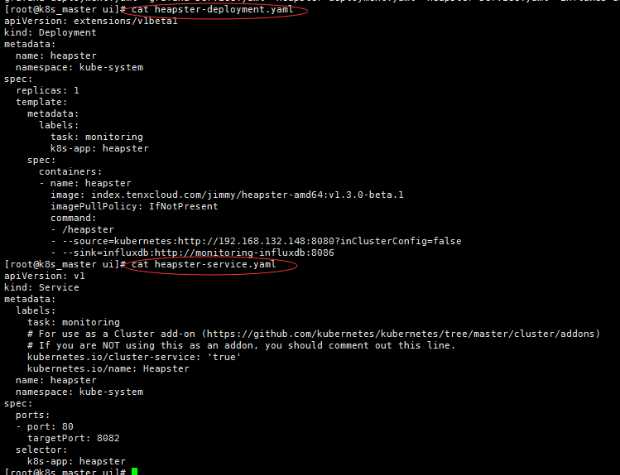
heapster-deployment.yaml
[root@k8s_master ui]# cat heapster-deployment.yaml
apiVersion: extensions/v1beta1
kind: Deployment
metadata:
  name: heapster
  namespace: kube-system
spec:
  replicas: 1
  template:
    metadata:
      labels:
        task: monitoring
        k8s-app: heapster
    spec:
      containers:
      - name: heapster
        image: index.tenxcloud.com/jimmy/heapster-amd64:v1.3.0-beta.1
        imagePullPolicy: IfNotPresent
        command:
        - /heapster
        - --source=kubernetes:http://192.168.132.148:8080?inClusterConfig=false
        - --sink=influxdb:http://monitoring-influxdb:8086
注意:修改- --source为自己的master apiserver访问地址 ,修改image地址(上面已经提供)
heapster-service.yaml
[root@k8s_master ui]# cat heapster-service.yaml
apiVersion: v1
kind: Service
metadata:
  labels:
    task: monitoring
    # For use as a Cluster add-on (https://github.com/kubernetes/kubernetes/tree/master/cluster/addons)
    # If you are NOT using this as an addon, you should comment out this line.
    kubernetes.io/cluster-service: ‘true‘
    kubernetes.io/name: Heapster
  name: heapster
  namespace: kube-system
spec:
  ports:
  - port: 80
    targetPort: 8082
  selector:
    k8s-app: heapster
创建deployment和service
#kubectl create -f heapster-deployment.yaml
#kubectl create -f heapster-service.yaml
配置Influxdb
influxdb 官方建议使用命令行或 HTTP API 接口来查询数据库,从 v1.1.0 版本开始默认关闭 admin UI,将在后续版本中移除 admin UI 插件。
开启镜像中 admin UI的办法如下:先导出镜像中的 influxdb 配置文件,开启插件后,再将配置文件内容写入 ConfigMap,最后挂载到镜像中,达到覆盖原始配置的目的。
$ #在镜像所在的宿主机上,导出镜像中的influxdb配置文件
$ docker run --rm --entrypoint ‘cat‘ -ti heapster-influxdb-amd64:v1.1.1 /etc/config.toml >config.toml.orig
$ cp config.toml.orig config.toml

$ # 修改:启用 admin 接口
$ vim config.toml
修改第35行
< enabled = false
---
> enabled = true
$ #将修改后的config.toml拷贝到Master上,再将修改后的配置写入到ConfigMap对象中
$ kubectl create configmap influxdb-config --from-file=config.toml -n kube-system
$ # 将ConfigMap中的配置文件挂载到Pod中,达到覆盖原始配置的目的
influxdb-deployment.yaml文件
[root@k8s_master ui]# cat influxdb-deployment.yaml
apiVersion: extensions/v1beta1
kind: Deployment
metadata:
  name: monitoring-influxdb
  namespace: kube-system
spec:
  replicas: 1
  template:
    metadata:
      labels:
        task: monitoring
        k8s-app: influxdb
    spec:
      containers:
      - name: influxdb
        image: index.tenxcloud.com/jimmy/heapster-influxdb-amd64:v1.1.1
        volumeMounts:
        - mountPath: /data
          name: influxdb-storage
        - mountPath: /etc/
          name: influxdb-config
      volumes:
      - name: influxdb-config
        configMap:
          name: influxdb-config
      - name: influxdb-storage
        emptyDir: {}
influxdb-service.yaml
[root@k8s_master ui]# cat influxdb-service.yaml
apiVersion: v1
kind: Service
metadata:
  labels:
    task: monitoring
    # For use as a Cluster add-on (https://github.com/kubernetes/kubernetes/tree/master/cluster/addons)
    # If you are NOT using this as an addon, you should comment out this line.
    kubernetes.io/cluster-service: ‘true‘
    kubernetes.io/name: monitoring-influxdb
  name: monitoring-influxdb
  namespace: kube-system
spec:
  type: NodePort
  ports:
  - port: 8086
    targetPort: 8086
    name: http
  - port: 8083
    targetPort: 8083
    name: api
  selector:
    k8s-app: influxdb
创建deployment和service
#kubectl create -f influxdb-deployment.yaml
#kubectl create -f influxdb-service.yaml
安装grafana
grafana-deployment.yaml
[root@k8s_master ui]# cat grafana-deployment.yaml
apiVersion: extensions/v1beta1
kind: Deployment
metadata:
  name: monitoring-grafana
  namespace: kube-system
spec:
  replicas: 1
  template:
    metadata:
      labels:
        task: monitoring
        k8s-app: grafana
    spec:
      containers:
      - name: grafana
        image: index.tenxcloud.com/jimmy/heapster-grafana-amd64:v4.0.2
        ports:
          - containerPort: 3000
            protocol: TCP
        volumeMounts:
        - mountPath: /var
          name: grafana-storage
        env:
        - name: INFLUXDB_HOST
          value: monitoring-influxdb
        - name: GRAFANA_PORT
          value: "3000"
          # The following env variables are required to make Grafana accessible via
          # the kubernetes api-server proxy. On production clusters, we recommend
          # removing these env variables, setup auth for grafana, and expose the grafana
          # service using a LoadBalancer or a public IP.
        - name: GF_AUTH_BASIC_ENABLED
          value: "false"
        - name: GF_AUTH_ANONYMOUS_ENABLED
          value: "true"
        - name: GF_AUTH_ANONYMOUS_ORG_ROLE
          value: Admin
        - name: GF_SERVER_ROOT_URL
          # If you‘re only using the API Server proxy, set this value instead:
          value: /api/v1/proxy/namespaces/kube-system/services/monitoring-grafana/
          #value: /
      volumes:
      - name: grafana-storage
        emptyDir: {}
grafana-service.yaml
[root@k8s_master ui]# cat grafana-service.yaml
apiVersion: v1
kind: Service
metadata:
  labels:
    # For use as a Cluster add-on (https://github.com/kubernetes/kubernetes/tree/master/cluster/addons)
    # If you are NOT using this as an addon, you should comment out this line.
    kubernetes.io/cluster-service: ‘true‘
    kubernetes.io/name: monitoring-grafana
  name: monitoring-grafana
  namespace: kube-system
spec:
  # In a production setup, we recommend accessing Grafana through an external Loadbalancer
  # or through a public IP.
  # type: LoadBalancer
  # You could also use NodePort to expose the service at a randomly-generated port
  # type: NodePort
  ports:
  - port: 80
    targetPort: 3000
  selector:
    k8s-app: grafana
创建deployment和service
#kubectl create -f grafana-deployment.yaml
#kubectl create -f grafana-service.yaml
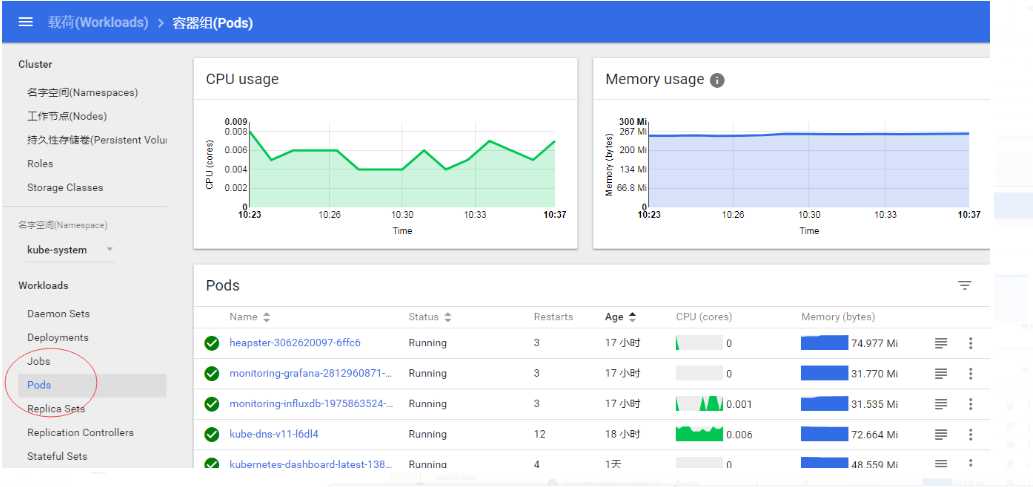
获取所有pod
[root@k8s_master ui]#  kubectl get pod -n kube-system
NAME                                           READY     STATUS    RESTARTS   AGE
heapster-3275159538-fdvhf                      1/1       Running   0          5s
kubernetes-dashboard-latest-1381663337-0wwml   1/1       Running   1          19h
monitoring-grafana-2812960871-gbsdf            1/1       Running   1          16h
monitoring-influxdb-1975863524-nmbpk           1/1       Running   1          16h
打印日志
[root@k8s_master ui]# kubectl logs -f pods/heapster-3275159538-fdvhf -n kube-system
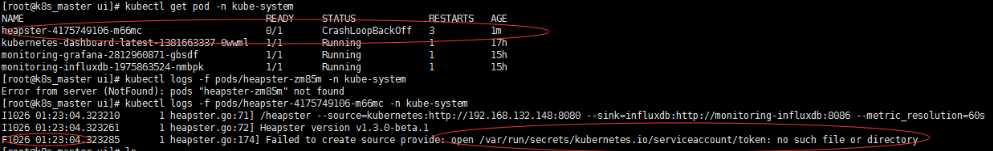
如果没有配置dns,Influxdb会报如下错误
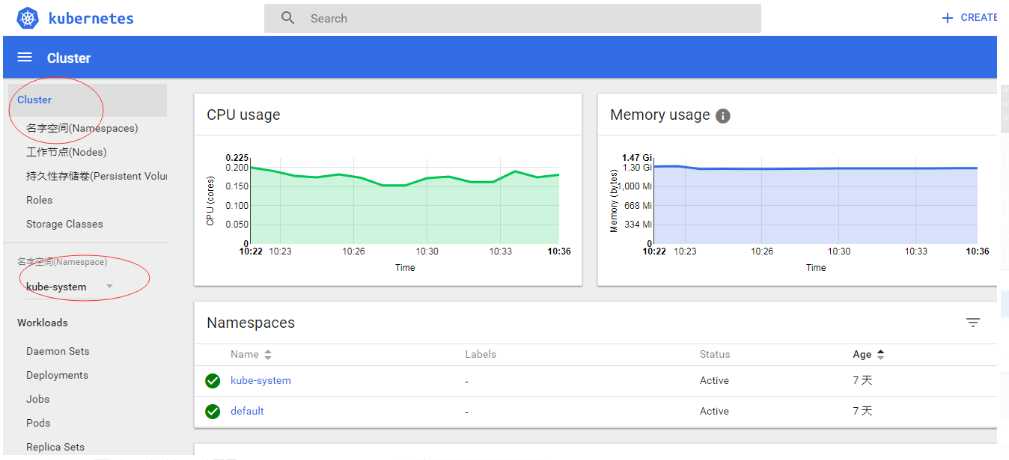
访问验证:
http://192.168.132.148:8080/ui
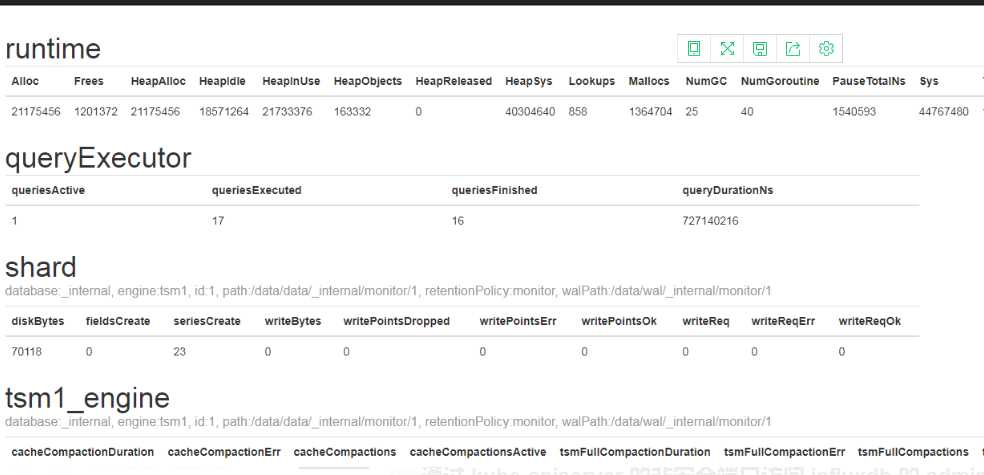
验证Influxdb
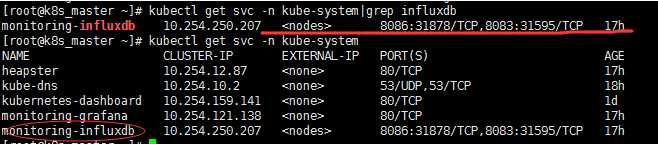
8086端口对应31878
访问:
http://192.168.132.148:8080/api/v1/proxy/namespaces/kube-system/services/monitoring-influxdb:8083/
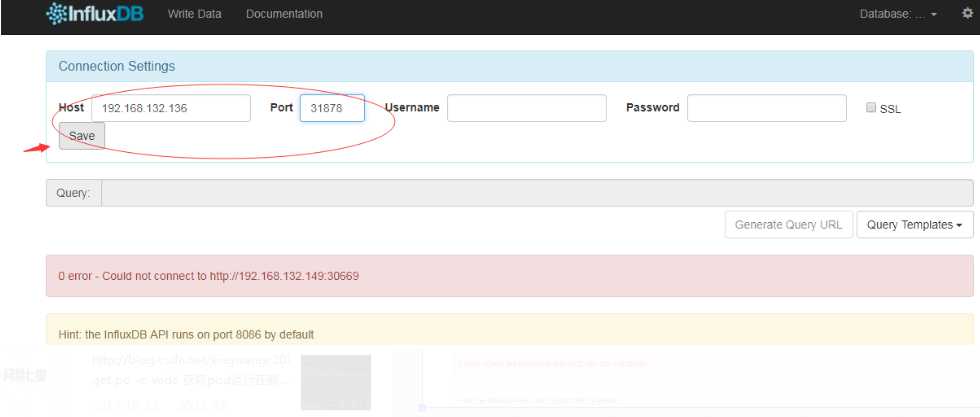
这里的ip为部署influxdb的主机
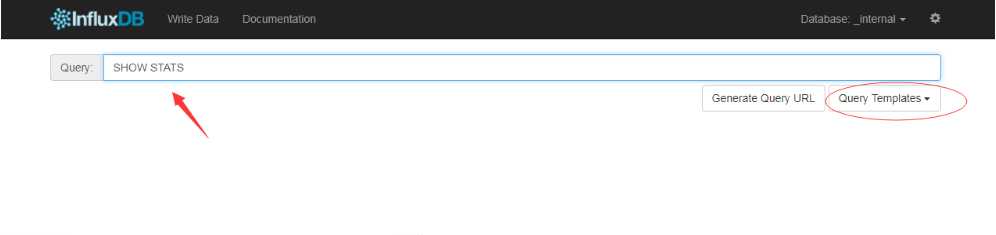
直接回车