要想优化一条 Query,我们就需要清楚的知道这条 Query 的性能瓶颈到底在哪里,是消耗的 CPU计算太多,还是需要的的 IO 操作太多?要想能够清楚的了解这些信息,在 MySQL 5.0 和 MySQL 5.1正式版中已经可以非常容易做到了,那就是通过 Query Profiler 功能。
MySQL 的 Query Profiler 是一个使用非常方便的 Query 诊断分析工具,通过该工具可以获取一条Query 在整个执行过程中多种资源的消耗情况,如 CPU,IO,IPC,SWAP 等,以及发生的 PAGE FAULTS,CONTEXT SWITCHE 等等,同时还能得到该 Query 执行过程中 MySQL 所调用的各个函数在源文件中的位置。
下面我们看看 Query Profiler 的具体用法。
0.可以在执行之前清空查询缓存
reset query cache;
1、 开启 profiling 参数
root@localhost : (none) 10:53:11> set profiling=1;
Query OK, 0 rows affected (0.00 sec)
通过执行 “set profiling”命令,可以开启关闭 Query Profiler 功能。
2、 执行 Query
root@localhost : test 07:43:18> select status,count(*)
-> from test_profiling group by status;
+----------------+----------+
| status | count(*) |
+----------------+----------+
| st_xxx1 | 27 |
| st_xxx2 | 6666 |
| st_xxx3 | 292887 |
| st_xxx4 | 15 |
+----------------+----------+
5 rows in set (1.11 sec)
... ...
在开启 Query Profiler 功能之后,MySQL 就会自动记录所有执行的 Query 的 profile 信息了。
3、获取系统中保存的所有 Query 的 profile 概要信息
root@localhost : test 07:47:35> show profiles;
+----------+------------+------------------------------------------------------------+
| Query_ID | Duration | Query
|
+----------+------------+------------------------------------------------------------+
| 1 | 0.00183100 | show databases
|
| 2 | 0.00007000 | SELECT DATABASE()
|
| 3 | 0.00099300 | desc test
|
| 4 | 0.00048800 | show tables
|
| 5 | 0.00430400 | desc test_profiling
|
| 6 | 1.90115800 | select status,count(*) from test_profiling group by status |
+----------+------------+------------------------------------------------------------+
3 rows in set (0.00 sec)
通过执行 “SHOW PROFILE” 命令获取当前系统中保存的多个 Query 的 profile 的概要信息。
4、针对单个 Query 获取详细的 profile 信息。
在获取到概要信息之后,我们就可以根据概要信息中的 Query_ID 来获取某个 Query 在执行过程中
详细的 profile 信息了,具体操作如下:
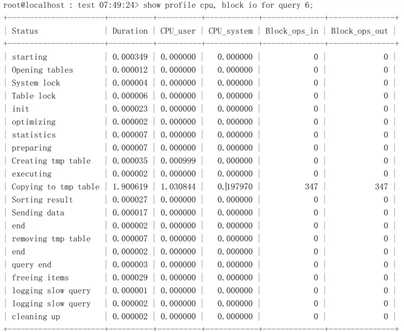
上面的例子中是获取 CPU 和 Block IO 的消耗,非常清晰,对于定位性能瓶颈非常适用。希望得到取其他的信息,都可以通过执行 “SHOW PROFILE *** FOR QUERY n” 来获取,各位读者朋友可以自行测试熟悉。