工具选择
这里参考了http://gernotklingler.com/blog/gprof-valgrind-gperftools-evaluation-tools-application-level-cpu-profiling-linux/这个博客,它主要分析了三款Linux平台下主流的热点分析工具,分别是GNU gprof、Valgrind和Google perftools,三款工具的主要特点如下表:
| 工具 | 使用命令 | 是否需要重新编译 | Profiling速度 | 是否支持多线程热点分析 | 是否支持链接库热点分析 |
| GNU gprof | ./test; gprof ./test ./gmon.out | 是 | 慢 | 否 | 否 |
| Valgrind | Valgrind --tool=callgrind ./test | 否 | 非常慢 | 是 | 是 |
| Google perftools | LD_PRELOAD=/usr/lib/libprofiler.so CPUPROFILE=./test.prof ./test | 否 | 快 | 是 | 是 |
gprof
gprof是GNU G++自带的热点分析工具,使用方法是:
- 使用 -pg 选项重新编译代码;
- 执行你刚才生成的程序,生成热点分析结果(默认名称为:gmont.out);
- 使用gprof查看结果。
相关命令:
#!/bin/bash

# build the program with profiling support (-gp)
g++ -std=c++11 -pg test.cpp -o test

# run the program; generates the profiling data file (gmon.out)
./test

# print the callgraph
gprof test
因为gprof要求用-pg重新编译代码,需要在Debug模式下进行Profiling,所以速度较慢。
另外gprof不支持多线程的热点分析。这个工具另一个大问题是,不支持链接库的热点分析。
很多大型项目为了模块化管理会生成很多动态链接库供其他程序调用,如果要分析每个模块的热点,这个工具就不适用了。
valgrind/callgrind
valgrind是一系列工具的套装,包括内存分析、热点分析等。它的使用非常简单,安装好之后,直接调用Vallgrind中的callgrind工具即可,命令为Valgrind --tool=callgrind ./test。使用该工具Profiling无需重新编译代码,也支持多线程和链接库的热点分析,但是由于Profiling原理的特殊性,其Profiling速度非常之慢,比直接运行程序慢了将近50倍,所以并不适合稍大型程序的热点分析。
使用方法:
- 编译代码;
- 利用Vallgrind执行你刚才生成的程序来获得分析文件:--tool=callgrind;
- 查看分析文件利用例如KCachegrind。
相关命令:
#!/bin/bash

# build the program (no special flags are needed)
g++ -std=c++11 test.cpp -o test

# run the program with callgrind; generates a file callgrind.out.12345 that can be viewed with kcachegrind
valgrind --tool=callgrind ./test

# open profile.callgrind with kcachegrind
kcachegrind profile.callgrind
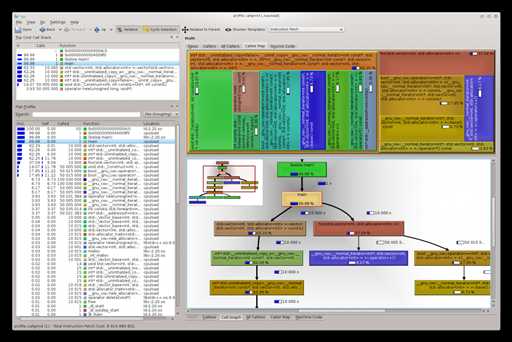
分析文件展示如图:
gperftools
gperftools原是Google内部的性能分析工具,后来在Github上开源了,地址是https://github.com/gperftools/gperftools。gperftools 的工作原理为通过定期采样当前正在执行的指令进行性能分析,如果某个函数被采样到的次数越多,则该函数在执行时占用的时间比例越大,很可能就是性能瓶颈。 gperftools 可以在被测软件处于 Release 模式下进行性能分析,所以能最大程度的模拟软件的实际使用情况。这个工具使用起来也比较简单。使用该工具Profiling无需重新编译代码,也支持多线程和链接库的热点分析,同时由于其是通过定期采样正在执行的指令进行热点分析,所以Profiling速度非常快,和正常release下执行程序的速度几乎相当。
所以在这里重点说明一下gperftools的用法。
安装libunwind
gperftools在64位系统上需要unwind库的支持,所以需要先安装libunwind,且官方文档推荐使用libunwind-0.99版本。
下载地址(注意可能要FQ):http://download.savannah.gnu.org/releases/libunwind/
安装gperftools
下载地址:https://github.com/gperftools/gperftools
安装 Graphviz 和 kcachegrind
执行:
sudo apt-get install graphviz
sudo apt-get install kcachegrind
怎么用gperftools
Gernot.Klingler博客上是这样写的:
Creating a CPU profile of selected parts of your application with gperftools requires the following steps:
- compile your program with debugging symbols enabled (to get a meaningful call graph) and link gperftools profiler.so
#include <gperftools/profiler.h>and surround the sections you want to profile withProfilerStart("nameOfProfile.log");andProfilerStop();- execute your program to generate the profiling data file(s)
- To analyze the profiling data, use pprof (distributed with gperftools) or convert it to a callgrind compatible format and analyze it with KCachegrind
命令:
#!/bin/bash

# build the program; For our demo program, we specify -DWITHGPERFTOOLS to enable the gperftools specific #ifdefs
g++ -std=c++11 -DWITHGPERFTOOLS -lprofiler -g ../cpuload.cpp -o cpuload

# run the program; generates the profiling data file (profile.log in our example)
./cpuload

# convert profile.log to callgrind compatible format
pprof --callgrind ./cpuload profile.log > profile.callgrind

# open profile.callgrind with kcachegrind
kcachegrind profile.callgrind
性能分析
在这里我还是用了valgrind,因为想安装gperftools的时候被墙了,同时valgrind安装也比gperftools简单的多。
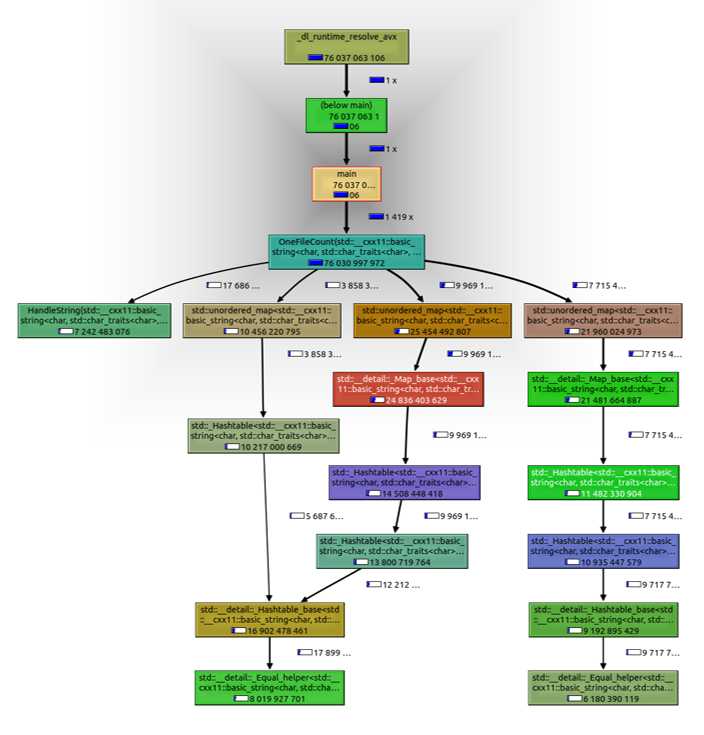
从图中可以看出OneFileCount()函数仍然占据了大部分的时间,而该函数中又以MAP的相关操作占大头,与WINDOWS下基本一致,根据这个情况可以提出下一步的优化目标,例如自己写HASH表等。