我们首先来加载我们自己的文本文件,并统计出排名前20的字符频率
if __name__=="__main__":
corpus_root=‘/home/zhf/word‘
wordlists=PlaintextCorpusReader(corpus_root,‘.*‘)
for w in wordlists.words():
print(w)
fdist=FreqDist(wordlists.words())
fdist.plot(20,cumulative=True)
文本内容如下:
the RRC setup success rate dropped
ERAB setup success rate dropped
prach issue
客户反馈
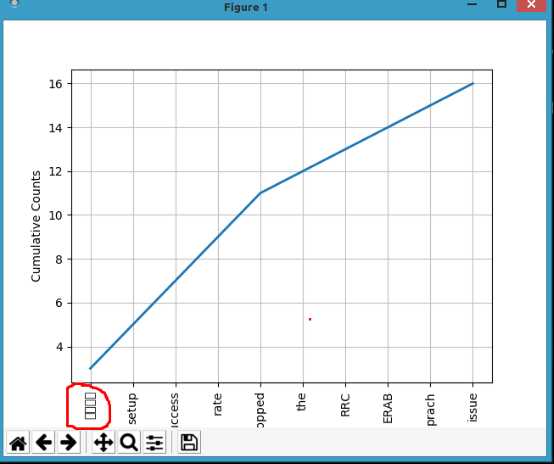
显示的图片如下,其中中文字符显示的是乱码。

这其中的原因在于nltk中的plt其实是调用的是matplotlib中的plot。而在ubuntun中
matplotlib 从配置文件 matplotlibrc 中读取配置,字体相关内容也在其中。matplotlib 依次在以下四个位置寻找配置文件:
- 当前工作目录下的 matplotlibrc。
- $MATPLOTLIBRC/matplotlibrc。
- 用户家目录下的 matplotlibrc。 如 Linux 一般在 ~/.config/matplotlib/matplotlibrc, macOS 在 ~/.matplotlib/matplotlibrc。
- INSTALL/matplotlib/mpl-data/matplotlibrc,其中 INSTALL 指具体的安装目录。
我们来看下matplotlib的配置文件放在哪的。通过下面两种方式可以查询到
方法一:可以查询出配置文件以及当前使用的字体方式。可以看出使用的字体是/DejaVuSans.ttf, 这个文件不是中文的。
from matplotlib.font_manager import findfont, FontProperties
if __name__=="__main__":
print(matplotlib.get_configdir())
print(findfont(FontProperties(family=FontProperties().get_family())))
/home/zhf/.config/matplotlib
/usr/local/lib/python3.6/dist-packages/matplotlib/mpl-data/fonts/ttf/DejaVuSans.ttf
方法二:能查出python2.7和python3.6各自的路径
root@zhf-maple:/home/zhf/桌面# locate -b \mpl-data
/usr/local/lib/python2.7/dist-packages/matplotlib/mpl-data
/usr/local/lib/python3.6/dist-packages/matplotlib/mpl-data
在mpl-data下进入font/ttf文件夹可以看到所有的字体方式,如果需要中文的话需要使用SimHei.ttf文件。可以看到没有这个文件

可以通过fc-list | grep SimHei命令查看当前系统下是否有安装simhei.ttf文件。如果有安装word文档的话应该都是有的。如果没有的话需要去网上去下载一个
root@zhf-maple:/home/zhf# fc-list | grep SimHei
/usr/share/fonts/wps-office/simhei.ttf: 黑体,SimHei:style=Regular,Normal,oby?ejné,Standard,Κανονικ?,Normaali,Normál,Normale,Standaard,Normalny,Обычный,Normálne,Navadno,Arrunta
将这个文件copy到
/usr/local/lib/python3.6/dist-packages/matplotlib/mpl-data/font/ttf文件夹下面
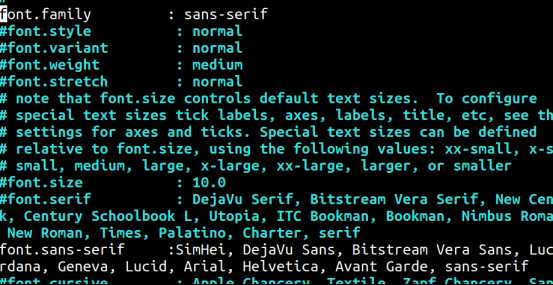
mpl-data目录下有matplotlib的配置文件matplotlibrc。进入编辑,在font.sans-serif中将SimHei设置为第一个也就是最高优先级。

清除matplotlib中的缓存
root@zhf-maple:/home/zhf/桌面# cd ~/.cache/matplotlib
root@zhf-maple:~/.cache/matplotlib# rm ‘*.*’
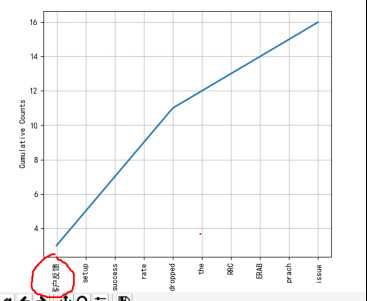
此时再运行可以看到中文正常显示

如果你只是想个别的文件使用中文,可以不用修改matplotlibrc配置文件,进行如下设置。也可以在单次调用的时候显示中文
matplotlib.rcParams[‘font.sans-serif‘] = ‘SimHei‘
x=[1,2,3]
y=[4,5,6]
plt.plot(x,y)
plt.title(‘测试‘)
plt.xlabel(‘x轴‘)
plt.ylabel(‘y轴‘)
plt.grid(True)
plt.show()
