标签:perl sys article compress name ilo root 需要 .net
转:https://blog.csdn.net/xusensen/article/details/54606401#sar%E7%AE%80%E4%BB%8B
sar(System Activity Reporter, 系统活动情况报告): 是用于监控Linux系统各个性能的优秀工具,包括:文件的读写情况、系统调用的使用情况、磁盘I/O、CPU效率、内存使用状况、进程活动及IPC有关的活动等。
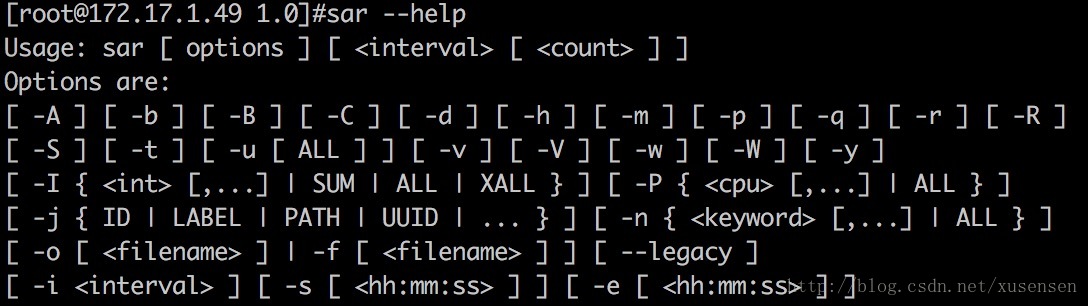
sar [ options ] [ <interval> [ <count> ] ]
其中:
interval: 采样周期,单位是秒;
count:采样次数,默认值是连续采样;
options:命令行选项。
sar命令的选项很多,下面只列出常用选项:
-A:所有报告的总和
-u:输出整体CPU使用情况的统计信息
-v:输出inode、文件和其他内核表的统计信息
-d:输出每一个块设备的活动信息
-r:输出内存和交换空间的统计信息
-b:显示I/O和传送速率的统计信息
-a:文件读写情况
-c:输出进程统计信息,每秒创建的进程数
-R:输出内存页面的统计信息
-y:终端设备活动情况
-w:输出系统交换活动信息
下文将说明如何使用sar获取以下性能分析数据:
- 整体CPU使用统计
- 各个CPU使用统计
- 内存使用情况统计
- 整体I/O情况
- 各个I/O设备情况
- 网络统计
使用-u选项,sar输出整体CPU的使用情况,不加选项时,默认使用的就是-u选项。以下命令显示采样时间为3s,采样次数为2次,整体CPU的使用情况:
sar 3 2 (或者 sar -u 3 2)
[root@HB05-uhost-130-157 tmp]# sar 3 2
Linux 2.6.32-279.19.31.el6.ucloud.x86_64 (HB05-uhost-130-157)   01/17/2017  _x86_64_    (32 CPU)

11:58:50 PM     CPU     %user     %nice   %system   %iowait    %steal     %idle
11:58:53 PM     all     13.25      0.00      3.16      3.72      0.00     79.87
11:58:56 PM     all     12.69      0.00      3.04      4.77      0.00     79.50
Average:        all     12.97      0.00      3.10      4.25      0.00     79.69
[root@HB05-uhost-130-157 tmp]# sar -u 3 2
Linux 2.6.32-279.19.31.el6.ucloud.x86_64 (HB05-uhost-130-157)   01/17/2017  _x86_64_    (32 CPU)

11:59:02 PM     CPU     %user     %nice   %system   %iowait    %steal     %idle
11:59:05 PM     all     22.24      0.00      3.60      8.14      0.00     66.02
11:59:08 PM     all     21.26      0.00      4.28      6.95      0.00     67.51
Average:        all     21.75      0.00      3.94      7.55      0.00     66.77
14
输出项说明:
CPU:all表示统计信息为所有CPU的平均值。
%usr:CPU在用户态执行进程的时间百分比。
%nice:CPU在用户态模式下,用于nice操作,所占用CPU总时间的百分比。
%system:CPU处在内核态执行进程的时间百分比。
%iowait:CPU用于等待I/O操作占用CPU总时间的百分比。
%steal:管理程序(hypervisor)为另一个虚拟进程提供服务而等待虚拟CPU的百分比。
%idle:CPU空闲时间百分比。
1. 若 %iowait 的值过高,表示硬盘存在I/O瓶颈
2. 若 %idle 的值高但系统响应慢时,有可能是 CPU 等待分配内存,此时应加大内存容量
3. 若 %idle 的值持续低于1,则系统的 CPU 处理能力相对较低,表明系统中最需要解决的资源是 CPU
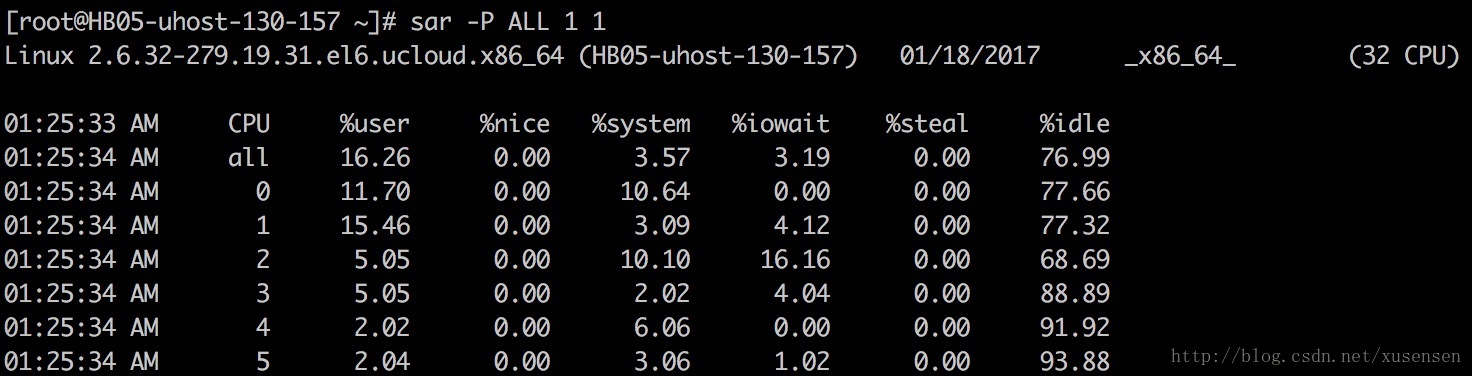
“-P ALL”选项指示对每个内核输出统计信息:
其中”CPU”列输出0,1,2,3,4,5指示对应的cpu核。也可针对单独一个内核显示,“-P 1”指示显示第二个内核的统计信息。
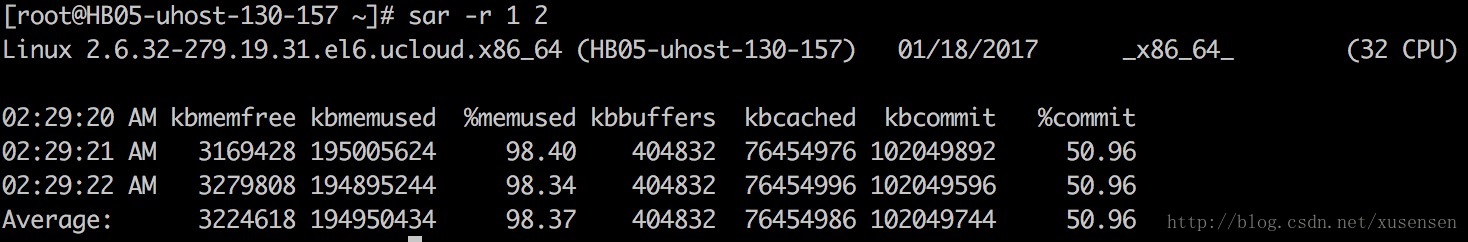
使用-r选项可显示内存统计信息,以下命令显示以1秒为采样时间,显示2次内存信息:
sar -r 1 2
| 参数参数 | 意义 |
|---|---|
| kbmemfree | Amount of free memory available in kilobytes. |
| kbmemused | Amount of used memory in kilobytes. This does not take into account memory used by the kernel itself. |
| %memused | Percentage of used memory |
| kbbuffers | Amount of memory used as buffers by the kernel in kilobytes. |
| kbcached | Amount of memory used to cache data by the kernel in kilobytes. |
| kbcommit | Amount of memory in kilobytes needed for current workload. This is an estimate of how much RAM/swap is needed to guarantee that there never is out of memory. |
| %commit | Percentage of memory needed for current workload in relation to the total amount of memory (RAM+swap). This number may be greater than 100% because the kernel usually overcommits memory. |
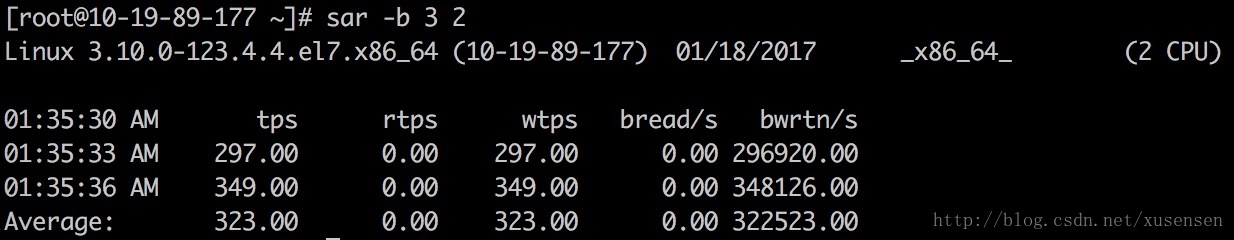
使用-b选项,可以显示磁盘I/O的使用情况:Report I/O and transfer rate statistics.
sar -b 3 2
输出项说明:
tps: 每秒向磁盘设备请求数据的次数,包括读、写请求,为rtps与wtps的和。出于效率考虑,每一次IO下发后并不是立即处理请求,而是将请求合并(merge),这里tps指请求合并后的请求计数。
rtps: 每秒向磁盘设备的读请求次数
wtps: 每秒向磁盘设备的写请求次数
bread/s:每秒钟从物理设备读入的数据量,单位为 块/s
bwrtn/s:每秒钟向物理设备写入的数据量,单位为 块/s
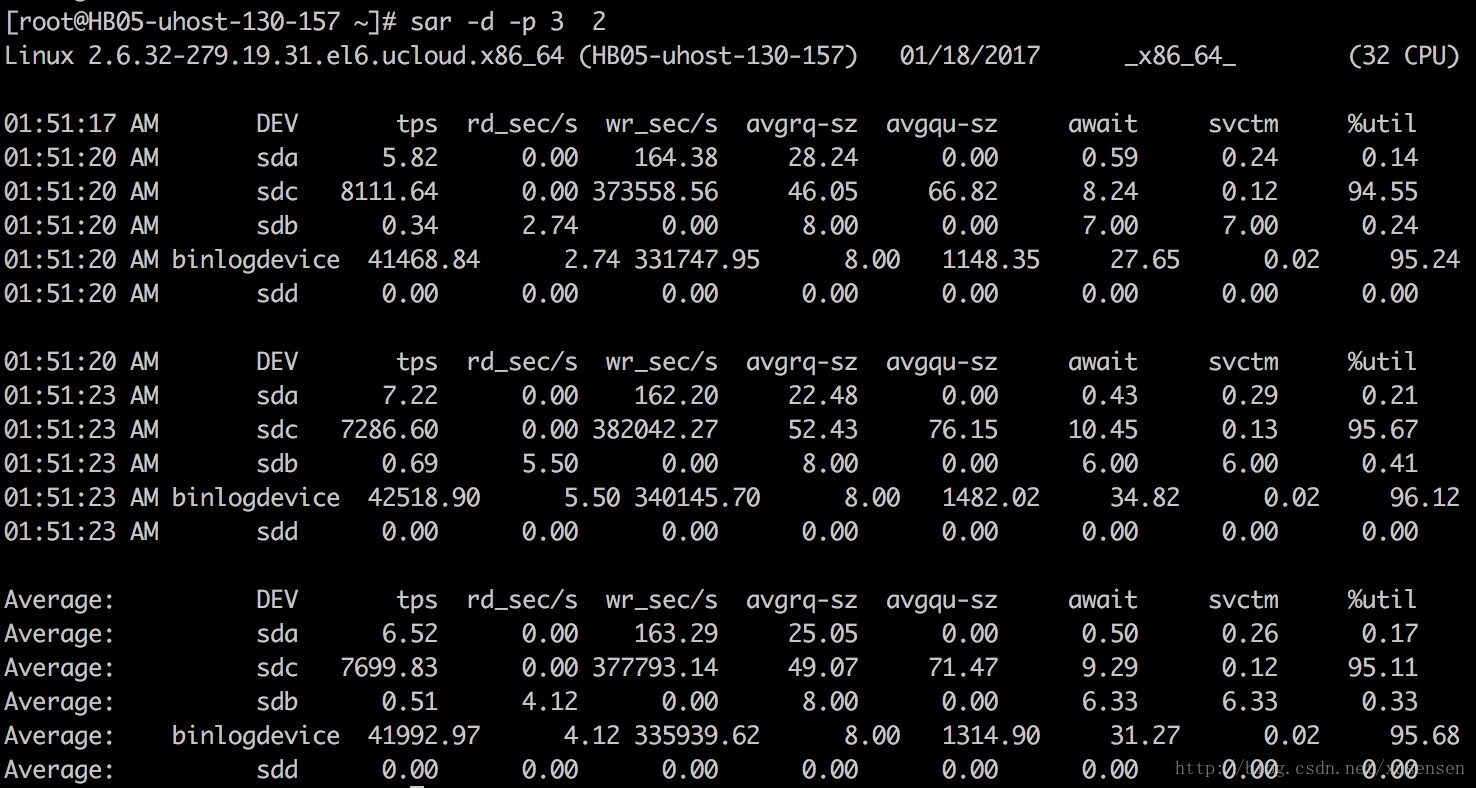
使用-d选项可以显示各个磁盘的统计信息,再增加-p选项可以以sdX的形式显示设备名称:
sar -d -p 3 2
输出项说明:
rd_sec/s: 每秒从设备读取的扇区数
wr_sec/s: 每秒往设备写入的扇区数
avgrq-sz: 发送给设备的请求的平均大小(以扇区为单位)
avgqu-sz: 发送给设备的请求队列的平均长度
await :服务等待I/O请求的平均时间,包括请求队列等待时间 (单位毫秒)
svctm :设备处理I/O请求的平均时间,不包括请求队列等待时间 (单位毫秒)
%util :一秒中有百分之多少的时间用于 I/O 操作,即被io消耗的cpu百分比。
备注:
- 如果 %util 接近 100%,说明产生的I/O请求太多,I/O系统已经满负荷,该磁盘可能存在瓶颈。
- 如果 svctm 比较接近 await,说明 I/O 几乎没有等待时间;如果 await 远大于 svctm,说明I/O 队列太长,io响应太慢,则需要进行必要优化。
- 如果avgqu-sz比较大,也表示有当量io在等待。
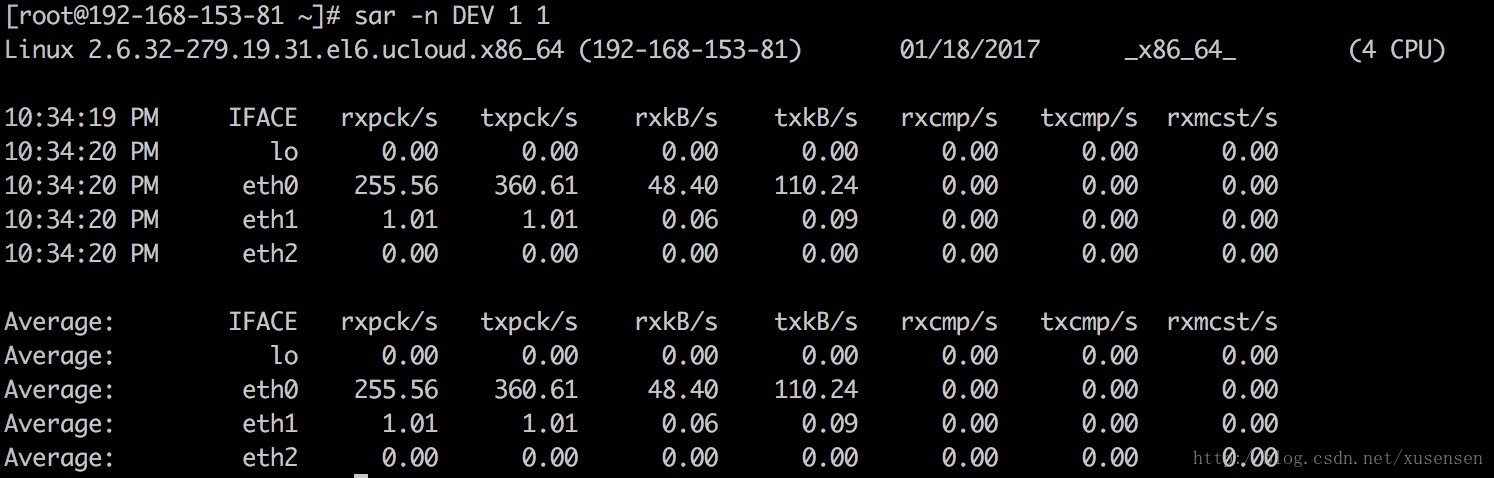
使用-n选项可以对网络使用情况进行显示,-n后接关键词”DEV”可显示eth0、eth1等网卡的信息:
sar -n DEV 1 1
以上主要输出含义如下:
IFACE: Name of the network interface for which statistics are reported.
rxpck/s: Total number of packets received per second.
txpck/s: Total number of packets transmitted per second.
rxkB/s: Total number of kilobytes(kB) received per second.
txkB/s: Total number of kilobytes(kB) transmitted per second.
rxcmp/s: Number of compressed packets received per second (for cslip etc.).
txcmp/s: Number of compressed packets transmitted per second.
rxmcst/s: Number of multicast packets received per second.
最后讲一下如何保存sar日志,使用-o选项,我们可以把sar统计信息保存到一个指定的文件,对于保存的日志,我们可以使用-f选项读取:
linux:~ # sar -n DEV 1 10 -o sar.out
linux:~ # sar -d 1 10 -f sar.out
相比将结果重定向到一个文件,使用-o选项,可以保存更多的系统资源信息。
1 http://www.thegeekstuff.com/2011/03/sar-examples/
2 http://www.cnblogs.com/bangerlee/articles/2545747.html
3 http://www.cnblogs.com/xianghang123/archive/2011/08/25/2153591.html
4 http://www.chinaz.com/server/2013/0401/297942.shtml
标签:perl sys article compress name ilo root 需要 .net
原文地址:https://www.cnblogs.com/ceshi2016/p/8945961.html