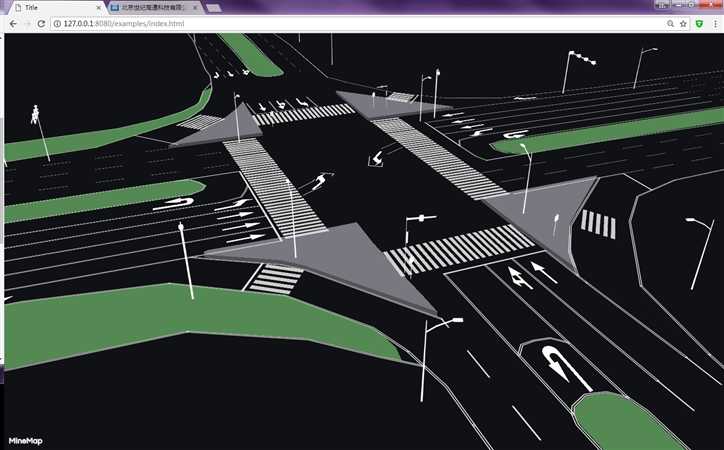
标签:png for har line api fun https IV alt
<!DOCTYPE html>
<html lang="en">
<head>
    <meta charset="UTF-8">
    <title>Title</title>

    <script src="../dist/threebox.js" type="text/javascript"></script>
    <!--
    <script src="threebox.js" type="text/javascript"></script>
    -->
    <link rel="stylesheet" href="https://minedata.cn/minemapapi/v1.3/minemap.css">
    <style>
        *{
            margin:0;
            padding:0;
        }
        body,html{
            height:100%;
        }
        #container,#map,#deck-layer{
            height:100%;
        }
        #deck-layer{
            position:absolute;
            top:0;
            left:0;
        }
    </style>
</head>
<body>
<div id="container">
    <div id="map"></div>

</div>


<script src="https://minedata.cn/minemapapi/v1.3/minemap.js"></script>
<script src="jingxihua3.js"></script>
<script>

minemap.accessToken = ‘449ba822788c46bea9f90dfba48e5269‘;
minemap.solution = ‘4013‘;

const map = new minemap.Map({
    container: ‘map‘,
    style: ‘http://minedata.cn/service/solu/style/id/4013‘,
    zoom: 19,
    maxZoom: 23,
    center: [116.244421,40.073263],
    pitch: 60
    //bearing: 140,
   // hash: true
});

//map.dragRotate.disable();
//map.touchZoomRotate.disableRotation();

 map.on("load", function() {
    map.setLayerZoomRange(‘96b6f495ae0d4bd78a1617d5afc58d9b‘,‘maxzoom‘,24)
        window.threebox = new Threebox(map);
        threebox.setupDefaultLights();

        var source = {
            type: "FeatureCollection",
            features: [
            {
                type: "Feature",
                properties: { model: "new_scene","size":1 },
                geometry: {
                    type: "Point",
                    coordinates: [116.245263,40.066957,-35]
                }
            }

            ]
        };

        var symbols = threebox.addSymbolLayer({
            id:             "scale",
            source:         source, // You can also specify a URL or relative path such as "data/points.geojson",
            modelName:      {property: ‘model‘},    // will look for an .obj and .mtl file with this name
            modelDirectory: "models/",          // in this directory
            //rotation:       { generator: feature => (new THREE.Euler(Math.PI / 2, Math.PI, 0, "ZXY")) },
            //scale:          { property: ‘size‘ },
            scale:          [1,1,1],
            rotation: { generator: feature => (new THREE.Euler(Math.PI / 2, 0, 90 * Math.PI / 180 + Math.PI / 2, "ZXY")) },

            scaleWithMapProjection: true
        });


        map.addLayer({
            id: "arrow", type: ‘fill‘,
            ‘source‘: {
            ‘type‘: ‘geojson‘,
            ‘data‘: jxh.arrow},

              paint: {
                ‘fill-opacity‘: 1,
                ‘fill-color‘: ‘#fff‘,
              },
              layout: {}

          })

          map.addLayer({
            id: "zebracrossing", type: ‘fill‘,
            ‘source‘: {
            ‘type‘: ‘geojson‘,
            ‘data‘: jxh.zebracrossing},
              paint: {
                ‘fill-opacity‘: 1,
                ‘fill-color‘: ‘#ccc‘,
              },
              layout: {}

          })

          map.addLayer(
          {
            id: "baise_xuxian",
            type: ‘line‘,
            source:{
            ‘type‘: ‘geojson‘,
            ‘data‘: jxh.baise_xuxian
            },
             paint: {
                ‘line-opacity‘: 1,
                ‘line-color‘: ‘#dddddd‘,
                ‘line-width‘: 3,
                "line-dasharray": [20,20]
              },
             layout: {
                ‘line-cap‘: ‘round‘,
              }

          })

          map.addLayer(
          {
            id: "baise_shuangshixian",
            type: ‘line‘,
            source:{
            ‘type‘: ‘geojson‘,
            ‘data‘: jxh.baise_shuangshixian
            },
             paint: {
                ‘line-opacity‘: 1,
                ‘line-color‘: ‘#dddddd‘,
                ‘line-width‘: 2 ,
                ‘line-gap-width‘: 2
              },
             layout: {
                ‘line-cap‘: ‘round‘,
              }

          })


          map.addLayer(
          {
            id: "huangse_xuxian",
            type: ‘line‘,
            source:{
            ‘type‘: ‘geojson‘,
            ‘data‘: jxh.huangse_xuxian
            },
             paint: {
                ‘line-opacity‘: 1,
                ‘line-color‘: ‘#ebb505‘,
                ‘line-width‘: 3,
                "line-dasharray": [20,20]
              },
             layout: {
                ‘line-cap‘: ‘round‘,
              }

          })


           map.addLayer(
          {
            id: "huangse_shuangshixian",
            type: ‘line‘,
            source:{
            ‘type‘: ‘geojson‘,
            ‘data‘: jxh.huangse_shuangshixian
            },
             paint: {
                ‘line-opacity‘: 1,
                ‘line-color‘: ‘#ebb505‘,
                ‘line-width‘: 2 ,
                ‘line-gap-width‘: 2
              },
             layout: {
                ‘line-cap‘: ‘round‘,
              }

          })


          map.addLayer(
          {
            id: "isolation_belt", type: ‘fill‘,
            source:{
            ‘type‘: ‘geojson‘,
            ‘data‘: jxh.isolation_belt
            },
              paint: {
                ‘fill-opacity‘: 0.55,
                ‘fill-color‘: ‘#8deb89‘,
              },
              layout: {}

          })


          map.addLayer(
          {
            id: "trafficisland", type: ‘extrusion‘,
             source:{
            ‘type‘: ‘geojson‘,
            ‘data‘: jxh.trafficisland
            },
              paint: {
                ‘extrusion-opacity‘: 0.5,
                ‘extrusion-color‘: ‘#dcd9e6‘,
                ‘extrusion-height‘: 0.5,
              },
              layout: {}

          })


        map.addLayer(
          {
            id: "stopline",
            type: ‘line‘,
            source:{
            ‘type‘: ‘geojson‘,
            ‘data‘: jxh.stopline
            },
             paint: {
                ‘line-opacity‘: 1,
                ‘line-color‘: ‘#dddddd‘,
                ‘line-width‘: 6
              },
             layout: {
                ‘line-cap‘: ‘round‘,
              }

          })

    });


    map.on(‘mousemove‘, function (e) {
    //console.log(e.lngLat)
    });
</script>
</body>
</html>

标签:png for har line api fun https IV alt
原文地址:https://www.cnblogs.com/lilei2blog/p/9125181.html