小书匠 Graph 图论
学过线性代数的都了解矩阵,在矩阵上的文章可做的很多,什么特征矩阵,单位矩阵等.grpah存储可以使用矩阵,比如graph的邻接矩阵,权重矩阵等,这节主要是在等到graph后,如何快速得到这些信息.详细官方文档在这里
目录:
注意:如果代码出现找不库,请返回第一个教程,把库文件导入.
12.graph和其他数据格式转换
12.1graph与字典(Dict)
-
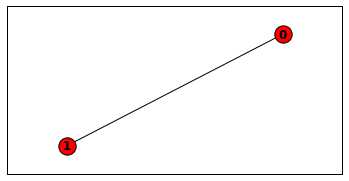
- dod = {0: {1: {‘weight‘: 1}}}
- G = nx.from_dict_of_dicts(dod)
- plt.subplots(1,1,figsize=(6,3))
- nx.draw(G, with_labels=True, font_weight=‘bold‘)
- plt.axis(‘on‘)
- plt.xticks([])
- plt.yticks([])
- plt.show()
-
-
- print(nx.to_dict_of_dicts(G))

graph与字典(Dict)示例
输出:
{0: {1: {‘weight‘: 1}}, 1: {0: {‘weight‘: 1}}}
12.2graph与列表(List)
-
- dol = {0: [1,2,3]}
- edgelist = [(0, 1),(0,3),(2,3)]
-
- G1 = nx.from_dict_of_lists(dol)
- G2=nx.from_edgelist(edgelist)
-
-
- plt.subplots(1,2,figsize=(15,3))
- plt.subplot(121)
- nx.draw(G1, with_labels=True, font_weight=‘bold‘)
- plt.axis(‘on‘)
- plt.xticks([])
- plt.yticks([])
- plt.subplot(122)
- nx.draw(G2, with_labels=True, font_weight=‘bold‘)
- plt.axis(‘on‘)
- plt.xticks([])
- plt.yticks([])
- plt.show()
-
-
- print(nx.to_dict_of_lists(G1))
- print(nx.to_edgelist(G1))

graph与列表(List)示例
输出:
{0: [1, 2, 3], 1: [0], 2: [0], 3: [0]}
[(0, 1, {}), (0, 2, {}), (0, 3, {})]
12.3graph与numpy
-
- import numpy as np
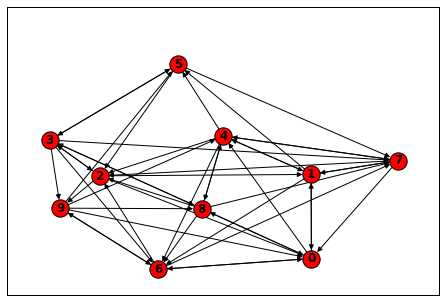
- a = np.reshape(np.random.random_integers(0, 1, size=100), (10, 10))
- D = nx.DiGraph(a)
- nx.draw(D, with_labels=True, font_weight=‘bold‘)
- plt.axis(‘on‘)
- plt.xticks([])
- plt.yticks([])
- plt.show()
-
-
- G=nx.Graph()
- G.add_edge(1, 2, weight=7.0, cost=5)
- A1 = nx.to_numpy_matrix(G)
- A2 = nx.to_numpy_recarray(G, dtype=[(‘weight‘, float), (‘cost‘, int)])
- print(A1,A2)

graph与numpy示例
输出:
- [[0. 7.]
- [7. 0.]] [[(0., 0) (7., 5)]
- [(7., 5) (0., 0)]]
12.4graph与Scipy
-
- G.clear()
- import scipy as sp
- A = sp.sparse.eye(2, 2, 1)
- G = nx.from_scipy_sparse_matrix(A)
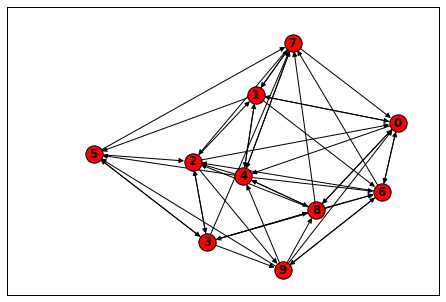
- nx.draw(D, with_labels=True, font_weight=‘bold‘)
- plt.axis(‘on‘)
- plt.xticks([])
- plt.yticks([])
- plt.show()
-
-
- A = nx.to_scipy_sparse_matrix(G)
- print(A.todense())

graph与Scipy示例
输出:
12.5graph与Pandas
-
- G.clear()
- import pandas as pd
- df = pd.DataFrame([[1, 1], [2, 1]])
- G = nx.from_pandas_adjacency(df)
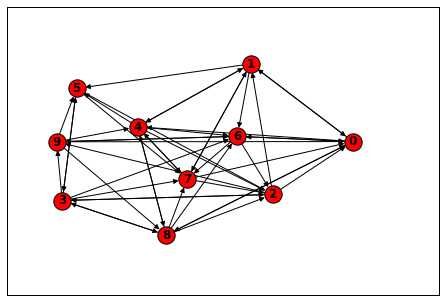
- nx.draw(D, with_labels=True, font_weight=‘bold‘)
- plt.axis(‘on‘)
- plt.xticks([])
- plt.yticks([])
- plt.show()
-
-
- df = nx.to_pandas_adjacency(G)
- print(df)

graph与Pandas示例
输出:


