标签:插件 log4j2 erro path test 日志 templates 实用 iso

[root@linux-node1 ~]# yum install nginx -y
[root@linux-node1 ~]# vim /etc/nginx/nginx.conf
#修改日志格式为json格式,并创建一个nginxweb的网站目录
log_format access_json ‘{"@timestamp":"$time_iso8601",‘
                           ‘"host":"$server_addr",‘
                           ‘"clientip":"$remote_addr",‘
                           ‘"size":$body_bytes_sent,‘
                           ‘"responsetime":$request_time,‘
                           ‘"upstreamtime":"$upstream_response_time",‘
                           ‘"upstreamhost":"$upstream_addr",‘
                           ‘"http_host":"$host",‘
                           ‘"url":"$uri",‘
                           ‘"domain":"$host",‘
                           ‘"xff":"$http_x_forwarded_for",‘
                           ‘"referer":"$http_referer",‘
                           ‘"status":"$status"}‘;
    access_log  /var/log/nginx/access.log  access_json;

        location /nginxweb {
                root html;
                index index.html index.htm;
        }
[root@linux-node1 ~]# mkdir /usr/share/nginx/html/nginxweb
[root@linux-node1 ~]# echo "<h1> welcome to use Nginx" > /usr/share/nginx/html/nginxweb/index.html
[root@linux-node1 ~]# nginx -t
nginx: the configuration file /etc/nginx/nginx.conf syntax is ok
nginx: configuration file /etc/nginx/nginx.conf test is successful
[root@linux-node1 ~]# systemctl start nginx
[root@linux-node1 ~]# vim /etc/logstash/conf.d/nginx-accesslog.conf
input{
    file {
        path => "/var/log/nginx/access.log"
        type => "nginx-access-log"
        start_position => "beginning"
        stat_interval => "2"
    }

}

output{
   elasticsearch {
        hosts => ["192.168.56.11:9200"]
        index => "logstash-nginx-access-log-%{+YYYY.MM.dd}"
   }
   file {
        path => "/tmp/logstash-nginx-access-log-%{+YYYY.MM.dd}"
   }
}
[root@linux-node1 ~]# /usr/share/logstash/bin/logstash -f /etc/logstash/conf.d/nginx_access.conf -t
[root@linux-node1 ~]# systemctl restart logstash
[root@linux-node1 ~]# ab -n1000 -c 100 http://192.168.56.11/nginxweb/index.html    #对页面压测
[root@linux-node1 ~]# tailf /var/log/nginx/access.log    #nginx的访问日志变成了json格式
{"@timestamp":"2017-12-27T16:38:17+08:00","host":"192.168.56.11","clientip":"192.168.56.11","size":26,"responsetime":0.000,"upstreamtime":"-","upstreamhost":"-","http_host":"192.168.56.11","url":"/nginxweb/index.html","domain":"192.168.56.11","xff":"-","referer":"-","status":"200"}
{"@timestamp":"2017-12-27T16:38:17+08:00","host":"192.168.56.11","clientip":"192.168.56.11","size":26,"responsetime":0.000,"upstreamtime":"-","upstreamhost":"-","http_host":"192.168.56.11","url":"/nginxweb/index.html","domain":"192.168.56.11","xff":"-","referer":"-","status":"200"}
{"@timestamp":"2017-12-27T16:38:17+08:00","host":"192.168.56.11","clientip":"192.168.56.11","size":26,"responsetime":0.000,"upstreamtime":"-","upstreamhost":"-","http_host":"192.168.56.11","url":"/nginxweb/index.html","domain":"192.168.56.11","xff":"-","referer":"-","status":"200"}
{"@timestamp":"2017-12-27T16:38:17+08:00","host":"192.168.56.11","clientip":"192.168.56.11","size":26,"responsetime":0.000,"upstreamtime":"-","upstreamhost":"-","http_host":"192.168.56.11","url":"/nginxweb/index.html","domain":"192.168.56.11","xff":"-","referer":"-","status":"200"}
{"@timestamp":"2017-12-27T16:38:17+08:00","host":"192.168.56.11","clientip":"192.168.56.11","size":26,"responsetime":0.000,"upstreamtime":"-","upstreamhost":"-","http_host":"192.168.56.11","url":"/nginxweb/index.html","domain":"192.168.56.11","xff":"-","referer":"-","status":"200"}
{"@timestamp":"2017-12-27T16:38:17+08:00","host":"192.168.56.11","clientip":"192.168.56.11","size":26,"responsetime":0.000,"upstreamtime":"-","upstreamhost":"-","http_host":"192.168.56.11","url":"/nginxweb/index.html","domain":"192.168.56.11","xff":"-","referer":"-","status":"200"}
{"@timestamp":"2017-12-27T16:38:17+08:00","host":"192.168.56.11","clientip":"192.168.56.11","size":26,"responsetime":0.000,"upstreamtime":"-","upstreamhost":"-","http_host":"192.168.56.11","url":"/nginxweb/index.html","domain":"192.168.56.11","xff":"-","referer":"-","status":"200"}
{"@timestamp":"2017-12-27T16:38:17+08:00","host":"192.168.56.11","clientip":"192.168.56.11","size":26,"responsetime":0.000,"upstreamtime":"-","upstreamhost":"-","http_host":"192.168.56.11","url":"/nginxweb/index.html","domain":"192.168.56.11","xff":"-","referer":"-","status":"200"}
{"@timestamp":"2017-12-27T16:38:17+08:00","host":"192.168.56.11","clientip":"192.168.56.11","size":26,"responsetime":0.000,"upstreamtime":"-","upstreamhost":"-","http_host":"192.168.56.11","url":"/nginxweb/index.html","domain":"192.168.56.11","xff":"-","referer":"-","status":"200"}
{"@timestamp":"2017-12-27T16:38:17+08:00","host":"192.168.56.11","clientip":"192.168.56.11","size":26,"responsetime":0.000,"upstreamtime":"-","upstreamhost":"-","http_host":"192.168.56.11","url":"/nginxweb/index.html","domain":"192.168.56.11","xff":"-","referer":"-","status":"200"}
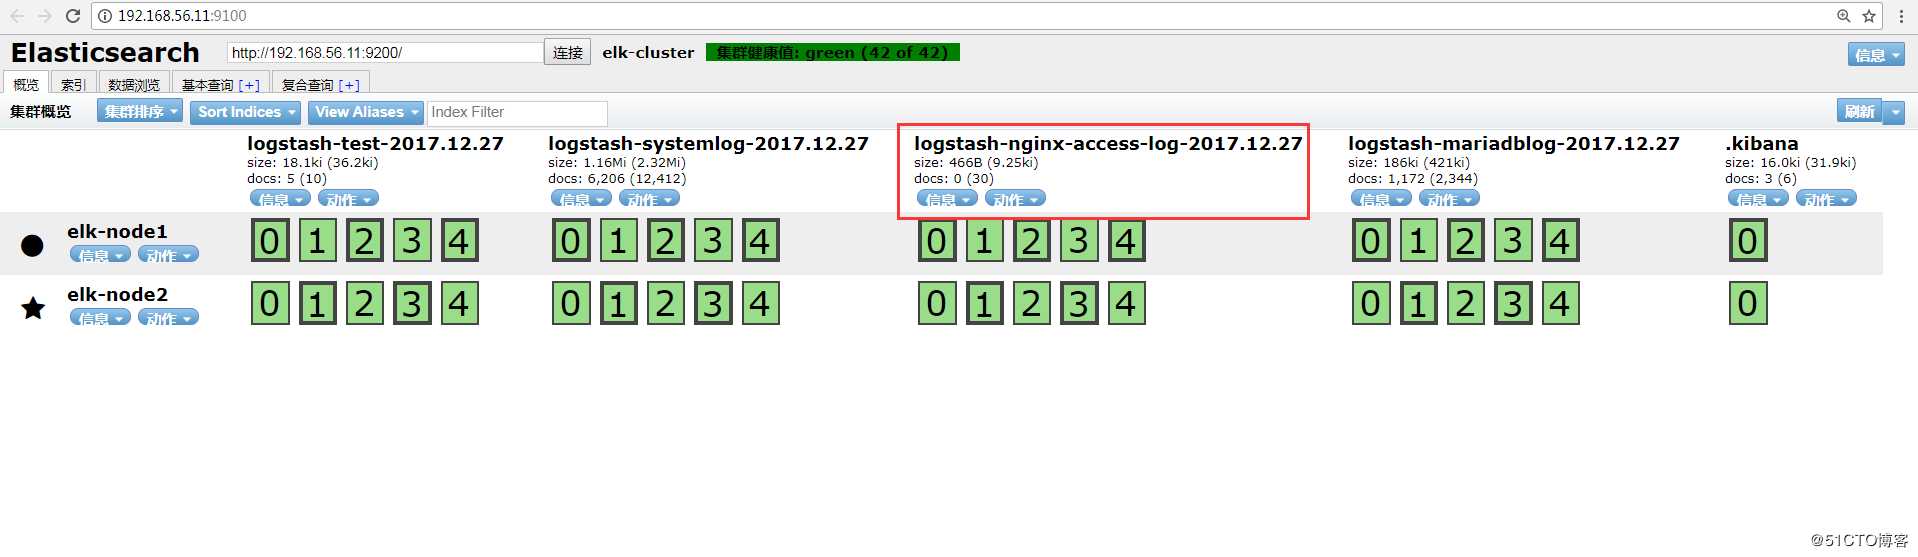
Head插件查看:
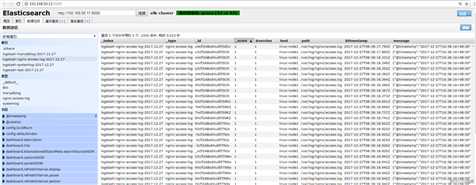
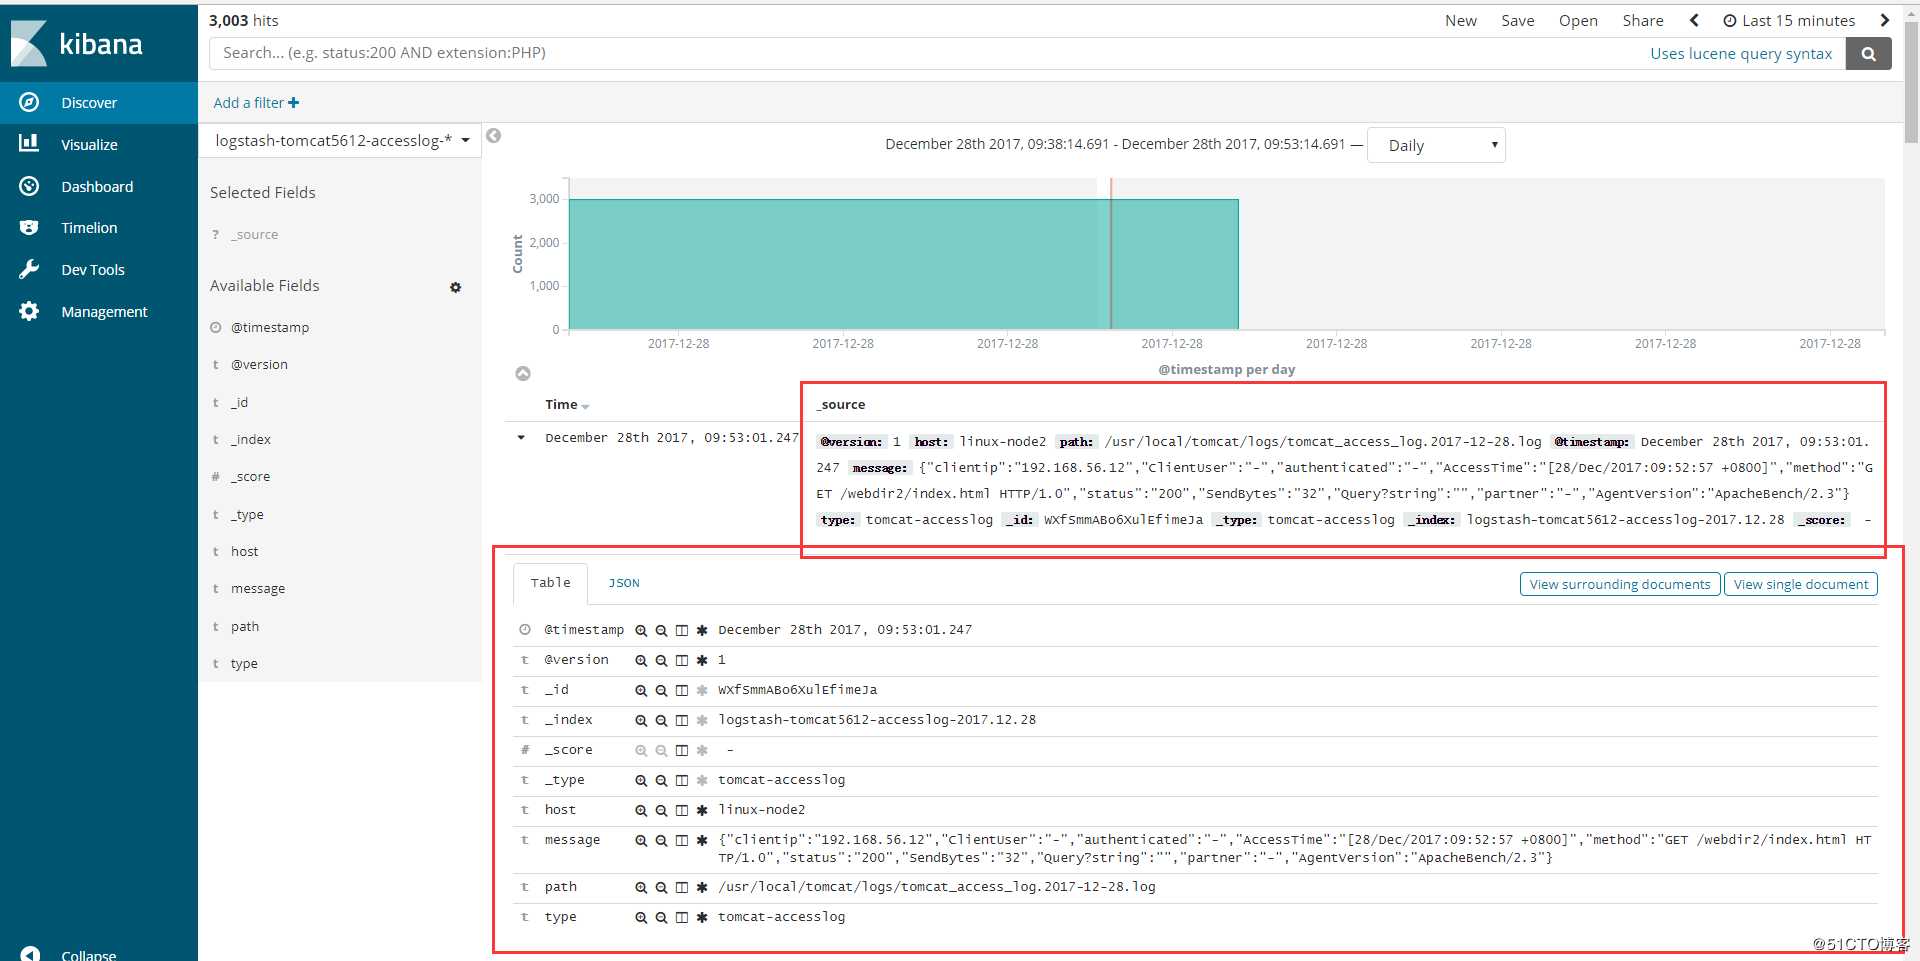
Kibana查看:
[root@linux-node2 ~]# wget http://apache.fayea.com/tomcat/tomcat-8/v8.5.20/bin/apache-tomcat-8.5.20.tar.gz
[root@linux-node2 ~]# tar -zxf apache-tomcat-8.5.24.tar.gz
[root@linux-node2 ~]# mv apache-tomcat-8.5.24 /usr/local/tomcat
[root@linux-node2 ~]# cd /usr/local/tomcat/conf
[root@linux-node2 conf ]# cp server.xml{,.bak}
[root@linux-node2 conf ]# vim server.xml
<Valve className="org.apache.catalina.valves.AccessLogValve" directory="logs"
               prefix="tomcat_access_log" suffix=".log"
               pattern="{"clientip":"%h","ClientUser":"%l","authenticated":"%u","AccessTime":"%t","method":"%r","status":"%s","SendBytes":"%b","Query?string":"%q","partner":"%{Referer}i","AgentVersion":"%{User-Agent}i"}"/>
[root@linux-node2 conf ]# cd ../webapps/
[root@linux-node2 webapps ]# mkdir webdir && cd webdir
[root@linux-node2 webdir ]# echo "<h1>welcome to use tomcat</h1>" > index.html
[root@linux-node2 conf ]# ../bin/catalina.sh start
[root@linux-node2 conf ]# netstat -tulnp |grep 8080
tcp6       0      0 :::8080                 :::*                    LISTEN      2362/java
[root@linux-node2 conf ]# ab -n1000 -c100 http://192.168.56.12:8080/webdir/index.html
[root@linux-node2 ~]# tailf /usr/local/tomcat/logs/tomcat_access_log.2017-12-28.log
{"clientip":"192.168.56.12","ClientUser":"-","authenticated":"-","AccessTime":"[28/Dec/2017:09:52:57 +0800]","method":"GET /webdir2/index.html HTTP/1.0","status":"200","SendBytes":"32","Query?string":"","partner":"-","AgentVersion":"ApacheBench/2.3"}
{"clientip":"192.168.56.12","ClientUser":"-","authenticated":"-","AccessTime":"[28/Dec/2017:09:52:57 +0800]","method":"GET /webdir2/index.html HTTP/1.0","status":"200","SendBytes":"32","Query?string":"","partner":"-","AgentVersion":"ApacheBench/2.3"}
{"clientip":"192.168.56.12","ClientUser":"-","authenticated":"-","AccessTime":"[28/Dec/2017:09:52:57 +0800]","method":"GET /webdir2/index.html HTTP/1.0","status":"200","SendBytes":"32","Query?string":"","partner":"-","AgentVersion":"ApacheBench/2.3"}
{"clientip":"192.168.56.12","ClientUser":"-","authenticated":"-","AccessTime":"[28/Dec/2017:09:52:57 +0800]","method":"GET /webdir2/index.html HTTP/1.0","status":"200","SendBytes":"32","Query?string":"","partner":"-","AgentVersion":"ApacheBench/2.3"}
{"clientip":"192.168.56.12","ClientUser":"-","authenticated":"-","AccessTime":"[28/Dec/2017:09:52:57 +0800]","method":"GET /webdir2/index.html HTTP/1.0","status":"200","SendBytes":"32","Query?string":"","partner":"-","AgentVersion":"ApacheBench/2.3"}
{"clientip":"192.168.56.12","ClientUser":"-","authenticated":"-","AccessTime":"[28/Dec/2017:09:52:57 +0800]","method":"GET /webdir2/index.html HTTP/1.0","status":"200","SendBytes":"32","Query?string":"","partner":"-","AgentVersion":"ApacheBench/2.3"}
{"clientip":"192.168.56.12","ClientUser":"-","authenticated":"-","AccessTime":"[28/Dec/2017:09:52:57 +0800]","method":"GET /webdir2/index.html HTTP/1.0","status":"200","SendBytes":"32","Query?string":"","partner":"-","AgentVersion":"ApacheBench/2.3"}
{"clientip":"192.168.56.12","ClientUser":"-","authenticated":"-","AccessTime":"[28/Dec/2017:09:52:56 +0800]","method":"GET /webdir2/index.html HTTP/1.0","status":"200","SendBytes":"32","Query?string":"","partner":"-","AgentVersion":"ApacheBench/2.3"}
{"clientip":"192.168.56.12","ClientUser":"-","authenticated":"-","AccessTime":"[28/Dec/2017:09:52:57 +0800]","method":"GET /webdir2/index.html HTTP/1.0","status":"200","SendBytes":"32","Query?string":"","partner":"-","AgentVersion":"ApacheBench/2.3"}
{"clientip":"192.168.56.12","ClientUser":"-","authenticated":"-","AccessTime":"[28/Dec/2017:09:52:57 +0800]","method":"GET /webdir2/index.html HTTP/1.0","status":"200","SendBytes":"32","Query?string":"","partner":"-","AgentVersion":"ApacheBench/2.3"}
[root@linux-node2 ~]# vim /etc/logstash/conf.d/tomcat_accesslog.conf
input {
        file {
                path => "/usr/local/tomcat/logs/tomcat_access_log.*.log"
                type => "tomcat-accesslog"
                start_position => "beginning"
                stat_interval => "2"
        }
}

output {
        elasticsearch {
                hosts => ["192.168.56.11:9200"]
                index => "logstash-tomcat5612-accesslog-%{+YYYY.MM.dd}"
        }
        file {
                path => "/tmp/logstash-tomcat5612-accesslog-%{+YYYY.MM.dd}"
        }
}
[root@linux-node2 tomcat]# /usr/share/logstash/bin/logstash -f /etc/logstash/conf.d/tomcat_accesslog.conf -t
OpenJDK 64-Bit Server VM warning: If the number of processors is expected to increase from one, then you should configure the number of parallel GC threads appropriately using -XX:ParallelGCThreads=N
WARNING: Could not find logstash.yml which is typically located in $LS_HOME/config or /etc/logstash. You can specify the path using --path.settings. Continuing using the defaults
Could not find log4j2 configuration at path /usr/share/logstash/config/log4j2.properties. Using default config which logs errors to the console
Configuration OK
[root@linux-node2 tomcat]# systemctl restart logstash
[root@linux-node2 tomcat]# ps -ef |grep logstash
logstash  2527     1 98 09:33 ?        00:00:28 /bin/java -XX:+UseParNewGC -XX:+UseConcMarkSweepGC -XX:CMSInitiatingOccupancyFraction=75 -XX:+UseCMSInitiatingOccupancyOnly -XX:+DisableExplicitGC -Djava.awt.headless=true -Dfile.encoding=UTF-8 -XX:+HeapDumpOnOutOfMemoryError -Xmx1g -Xms256m -Xss2048k -Djffi.boot.library.path=/usr/share/logstash/vendor/jruby/lib/jni -Xbootclasspath/a:/usr/share/logstash/vendor/jruby/lib/jruby.jar -classpath : -Djruby.home=/usr/share/logstash/vendor/jruby -Djruby.lib=/usr/share/logstash/vendor/jruby/lib -Djruby.script=jruby -Djruby.shell=/bin/sh org.jruby.Main /usr/share/logstash/lib/bootstrap/environment.rb logstash/runner.rb --path.settings /etc/logstash
root      2572 15939  0 09:34 pts/3    00:00:00 grep --color=auto logstash
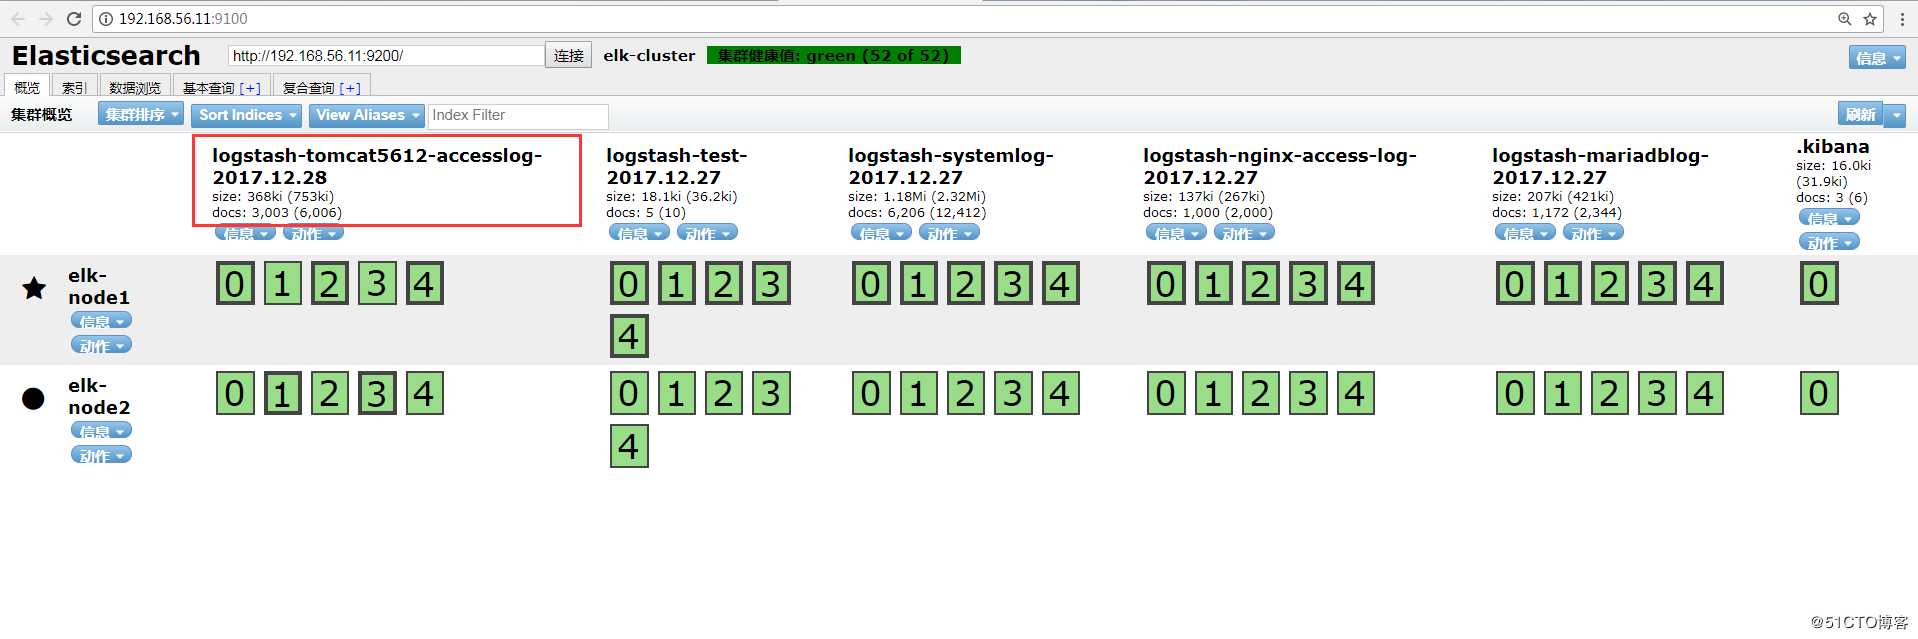
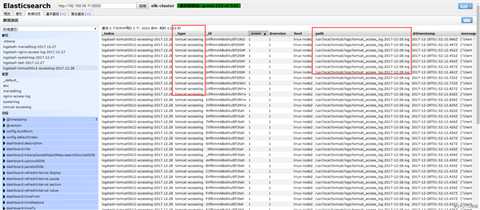
数据浏览:
注:此处如果无法出现tomcat的数据索引,查看一下是否有权限访问日志。
[root@linux-node2 logs]# ll /usr/local/tomcat/logs/ -d
drwxr-x--- 2 root root 4096 12月 28 09:29 /usr/local/tomcat/logs/
[root@linux-node2 logs]# chmod 755 /usr/local/tomcat/logs
[root@linux-node2 logs]# ll /usr/local/tomcat/logs/
总用量 512
-rw-r----- 1 root root   7140 12月 28 09:29 catalina.2017-12-28.log
-rw-r----- 1 root root   7140 12月 28 09:29 catalina.out
-rw-r----- 1 root root      0 12月 28 09:29 host-manager.2017-12-28.log
-rw-r----- 1 root root    284 12月 28 09:29 localhost.2017-12-28.log
-rw-r----- 1 root root      0 12月 28 09:29 manager.2017-12-28.log
-rw-r----- 1 root root 502039 12月 28 09:47 tomcat_access_log.2017-12-28.log
[root@linux-node2 logs]# chmod 644 /usr/local/tomcat/logs/
使用codec的multiline插件实现多行匹配,这是一个可以将多行进行合并的插件,而且可以使用what指定将匹配到的行与前面的行合并还是和后面的行合并。
https://www.elastic.co/guide/en/logstash/6.0/plugins-codecs-multiline.html
语法例子:
input {
  stdin {
    codec => multiline {    #使用multiline插件
      pattern => "pattern, a regexp"   #正则匹配
      negate => "true" or "false"     #匹配是否成功
      what => "previous" or "next"   #和上面的还是和下面的内容合并
    }
  }
}
命令行测试输入输出
[root@linux-node1 ~]# /usr/share/logstash/bin/logstash -e ‘input { stdin {codec => multiline { pattern => "^\[" negate => "true" what => "previous"} }} output { stdout {codec => rubydebug}}‘
OpenJDK 64-Bit Server VM warning: If the number of processors is expected to increase from one, then you should configure the number of parallel GC threads appropriately using -XX:ParallelGCThreads=N
WARNING: Could not find logstash.yml which is typically located in $LS_HOME/config or /etc/logstash. You can specify the path using --path.settings. Continuing using the defaults
Could not find log4j2 configuration at path /usr/share/logstash/config/log4j2.properties. Using default config which logs errors to the console
The stdin plugin is now waiting for input:
111111111
22222222222
333333333
[5555555555
{
      "@version" => "1",
          "host" => "linux-node1",
    "@timestamp" => 2017-12-28T03:06:11.663Z,
       "message" => "111111111\n22222222222\n333333333",   #会将[开头前面的进行合并
          "tags" => [
        [0] "multiline"
    ]
}
666666666666666666
77777777777777777
8888888888
[999999999
{
      "@version" => "1",
          "host" => "linux-node1",
    "@timestamp" => 2017-12-28T03:06:37.326Z,
       "message" => "[5555555555\n666666666666666666\n77777777777777777\n8888888888",
          "tags" => [
        [0] "multiline"
    ]
}
elk集群日志上都是以”[“开头并且每一个信息都是如此,寻找规律
[root@linux-node1 ~]# tailf /data/logs/elk-cluster.log
[2017-12-28T09:36:58,486][INFO ][o.e.c.s.MasterService    ] [elk-node1] zen-disco-node-join[{elk-node2}{CcF5fl9sRqCAGYYpT3scuw}{ncgZ1UsPRq-iz6zWHPl7PQ}{192.168.56.12}{192.168.56.12:9300}], reason: added {{elk-node2}{CcF5fl9sRqCAGYYpT3scuw}{ncgZ1UsPRq-iz6zWHPl7PQ}{192.168.56.12}{192.168.56.12:9300},}
[2017-12-28T09:36:59,297][INFO ][o.e.c.s.ClusterApplierService] [elk-node1] added {{elk-node2}{CcF5fl9sRqCAGYYpT3scuw}{ncgZ1UsPRq-iz6zWHPl7PQ}{192.168.56.12}{192.168.56.12:9300},}, reason: apply cluster state (from master [master {elk-node1}{Ulw9eIPlS06sl8Z6zQ_z4g}{HgJRMEAcQcqFOTn5ehHPdw}{192.168.56.11}{192.168.56.11:9300} committed version [87] source [zen-disco-node-join[{elk-node2}{CcF5fl9sRqCAGYYpT3scuw}{ncgZ1UsPRq-iz6zWHPl7PQ}{192.168.56.12}{192.168.56.12:9300}]]])
[2017-12-28T09:36:59,310][WARN ][o.e.d.z.ElectMasterService] [elk-node1] value for setting "discovery.zen.minimum_master_nodes" is too low. This can result in data loss! Please set it to at least a quorum of master-eligible nodes (current value: [-1], total number of master-eligible nodes used for publishing in this round: [2])
[2017-12-28T09:37:06,580][INFO ][o.e.c.r.a.AllocationService] [elk-node1] Cluster health status changed from [YELLOW] to [GREEN] (reason: [shards started [[.kibana][0]] ...]).
[2017-12-28T09:52:11,090][INFO ][o.e.c.m.MetaDataCreateIndexService] [elk-node1] [logstash-tomcat5612-accesslog-2017.12.28] creating index, cause [auto(bulk api)], templates [logstash], shards [5]/[1], mappings [_default_]
[2017-12-28T09:52:11,433][INFO ][o.e.c.m.MetaDataMappingService] [elk-node1] [logstash-tomcat5612-accesslog-2017.12.28/YY4yqUQJRHa2mRUwmd2Y8g] create_mapping [tomcat-accesslog]
[2017-12-28T09:52:13,389][INFO ][o.e.c.r.a.AllocationService] [elk-node1] Cluster health status changed from [YELLOW] to [GREEN] (reason: [shards started [[logstash-tomcat5612-accesslog-2017.12.28][4]] ...]).
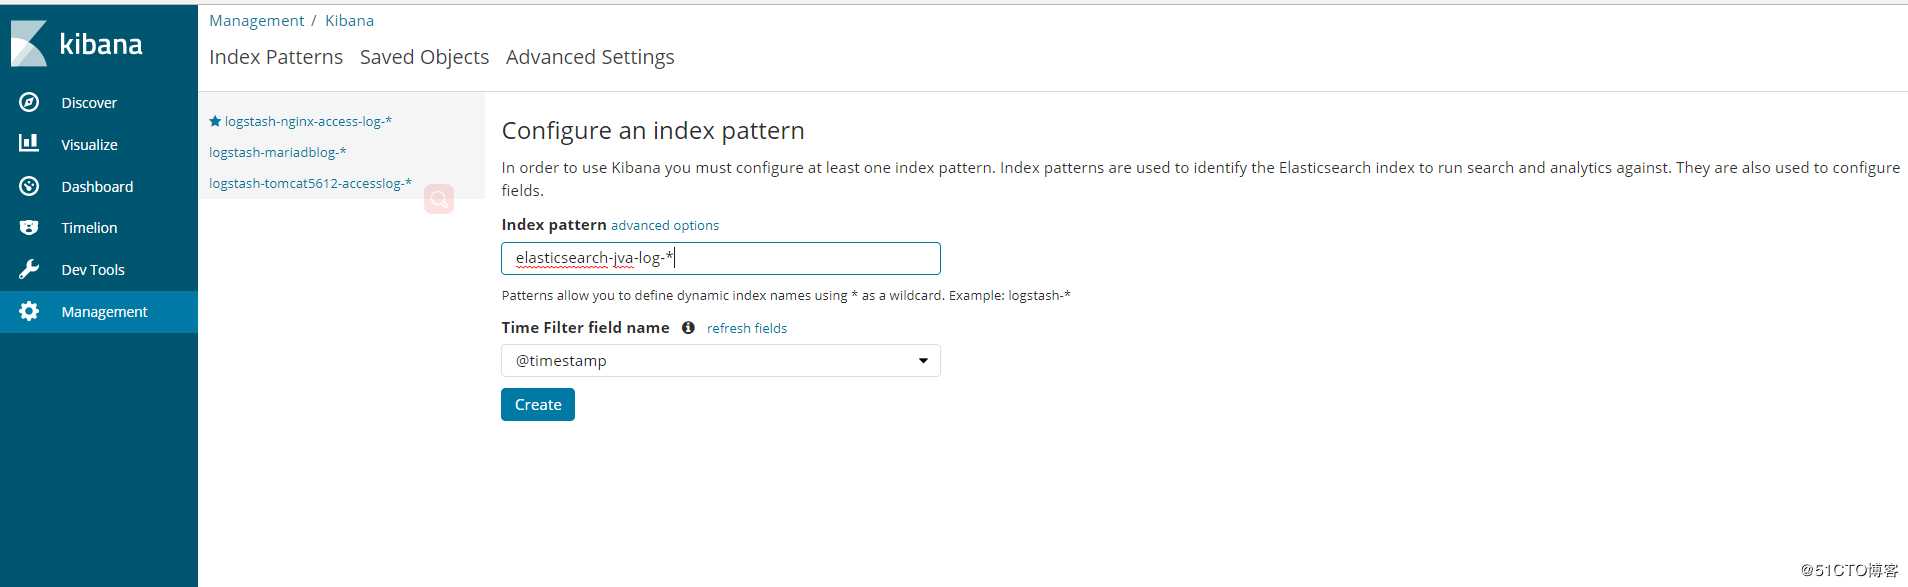
[root@linux-node1 ~]# vim /etc/logstash/conf.d/java.conf
input {
        file{
                path => "/data/logs/elk-cluster.log"
                type => "elasticsearch-java-log"
                start_position => "beginning"
                stat_interval => "2"
                code => multiline {
                        pattern => "^\["    #以"["开头进行正则匹配,匹配规则
                        negate => "true"  #正则匹配成功,false匹配不成功
                        what => "previous"  #和前面的内容进行合并,如果是和下面的合并就是next
                }
        }
}

output {
        if [type] == "elasticsearch-java-log" {
                elasticsearch {
                        hosts => ["192.168.56.11:9200"]
                        index => "elasticsearch-jva-log-%{+YYYY.MM.dd}"
                }
        }
}
[root@linux-node1 ~]# /usr/share/logstash/bin/logstash -f /etc/logstash/conf.d/java.conf -t
OpenJDK 64-Bit Server VM warning: If the number of processors is expected to increase from one, then you should configure the number of parallel GC threads appropriately using -XX:ParallelGCThreads=N
WARNING: Could not find logstash.yml which is typically located in $LS_HOME/config or /etc/logstash. You can specify the path using --path.settings. Continuing using the defaults
Could not find log4j2 configuration at path /usr/share/logstash/config/log4j2.properties. Using default config which logs errors to the console
Configuration OK
[root@linux-node1 ~]# systemctl restart logstash
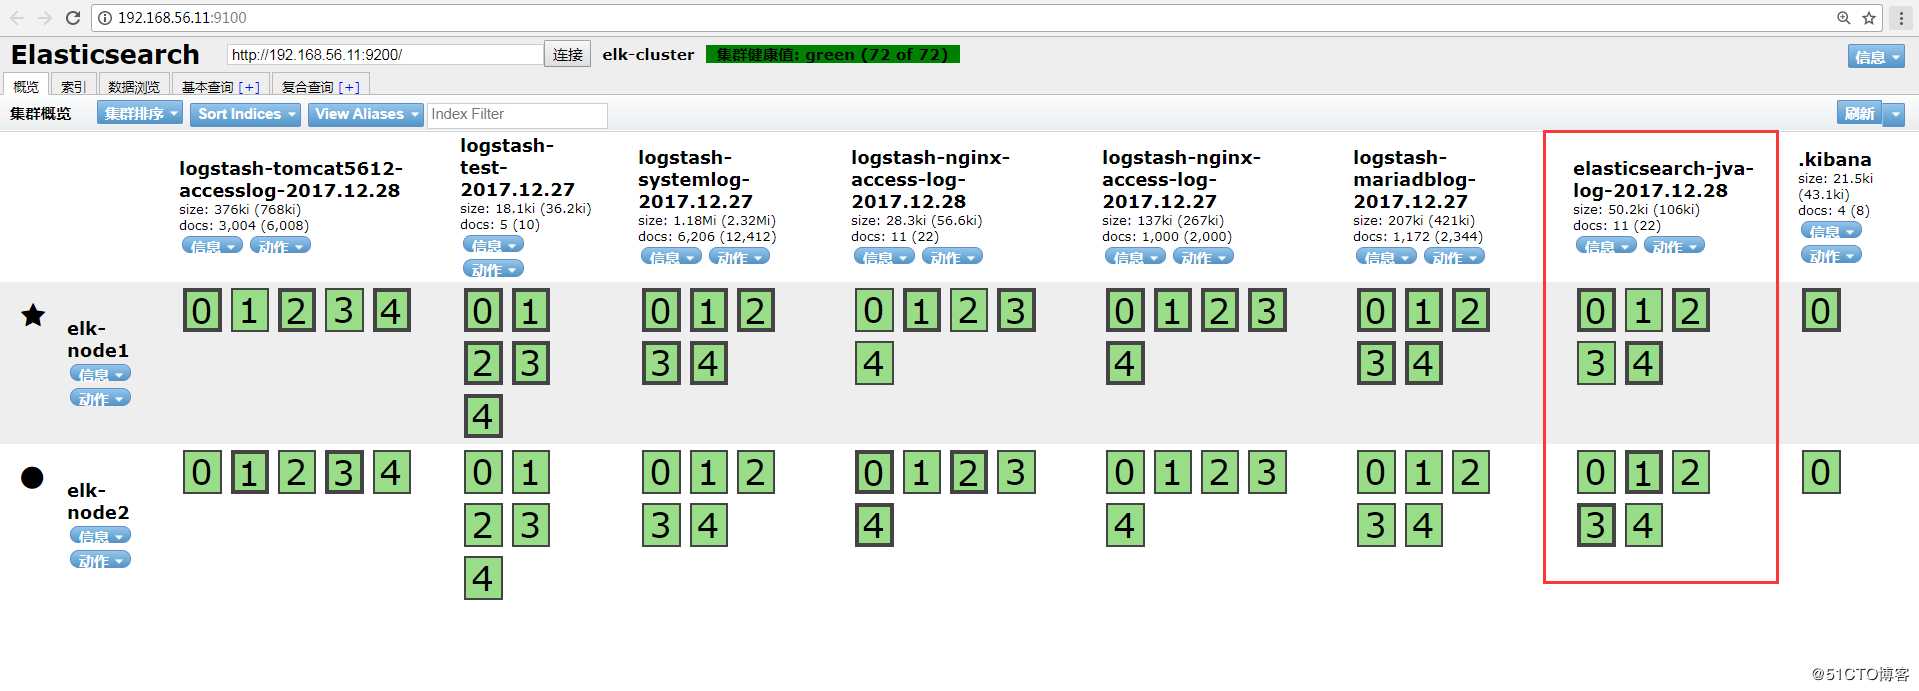
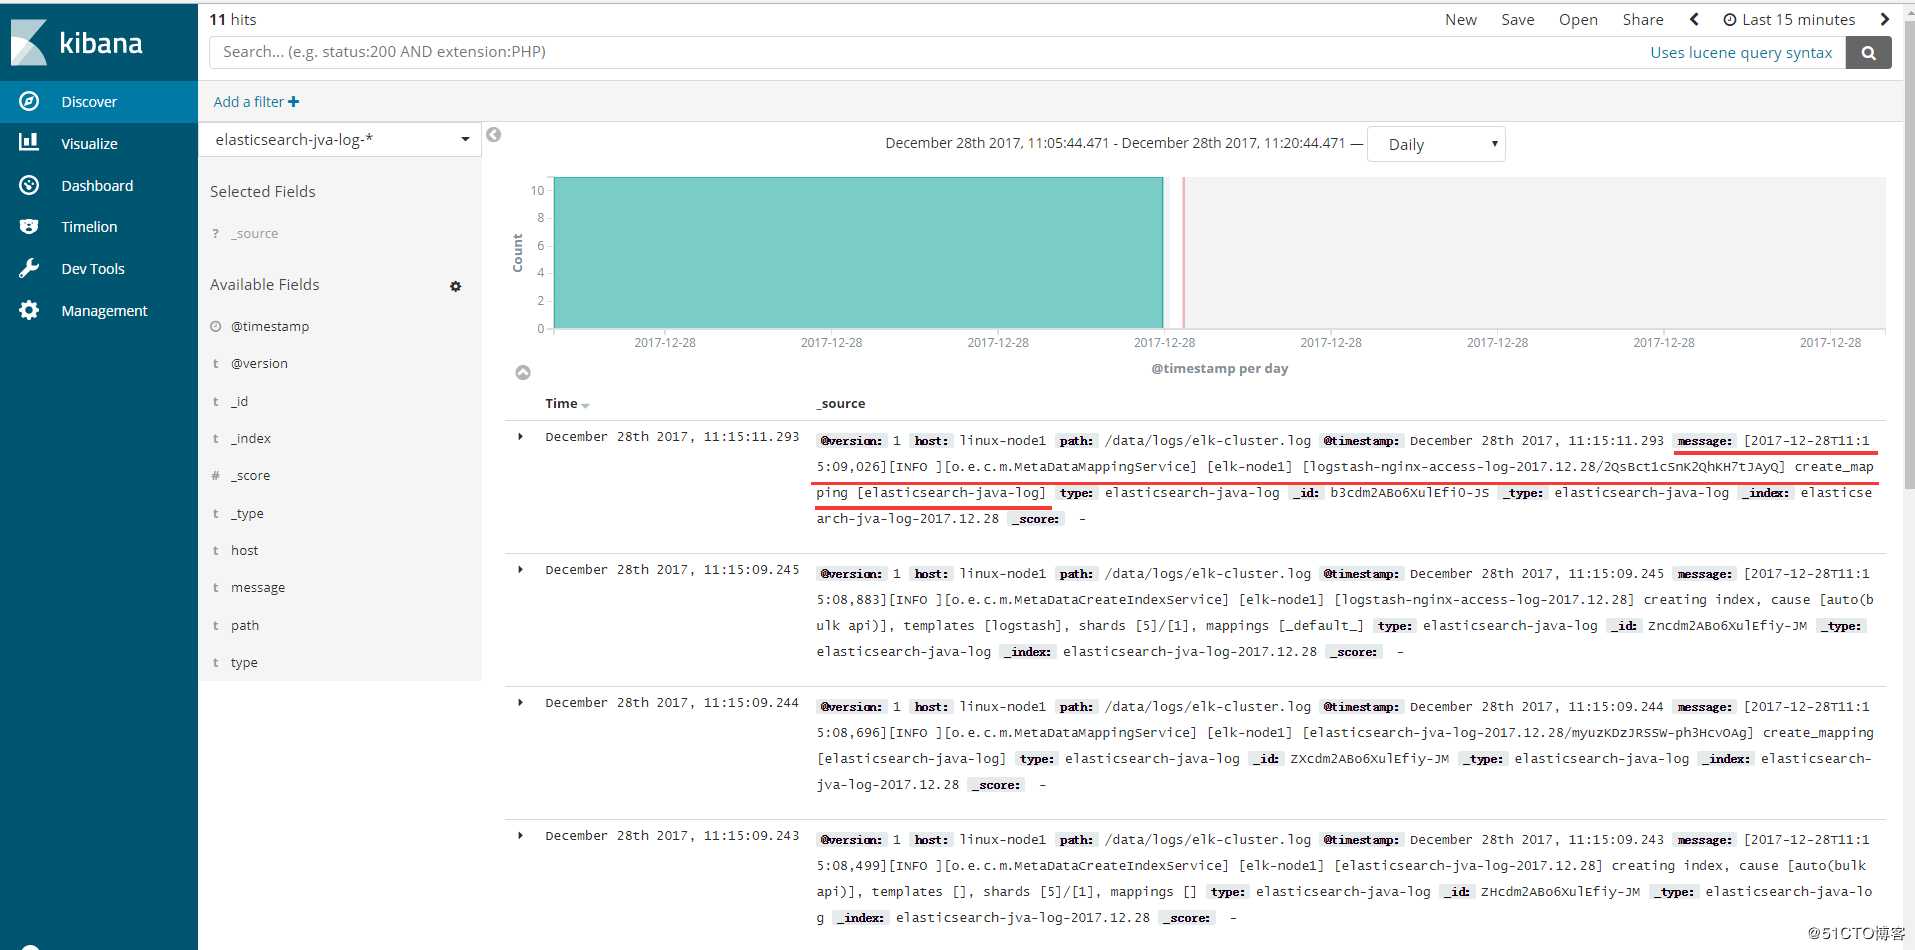
数据浏览:
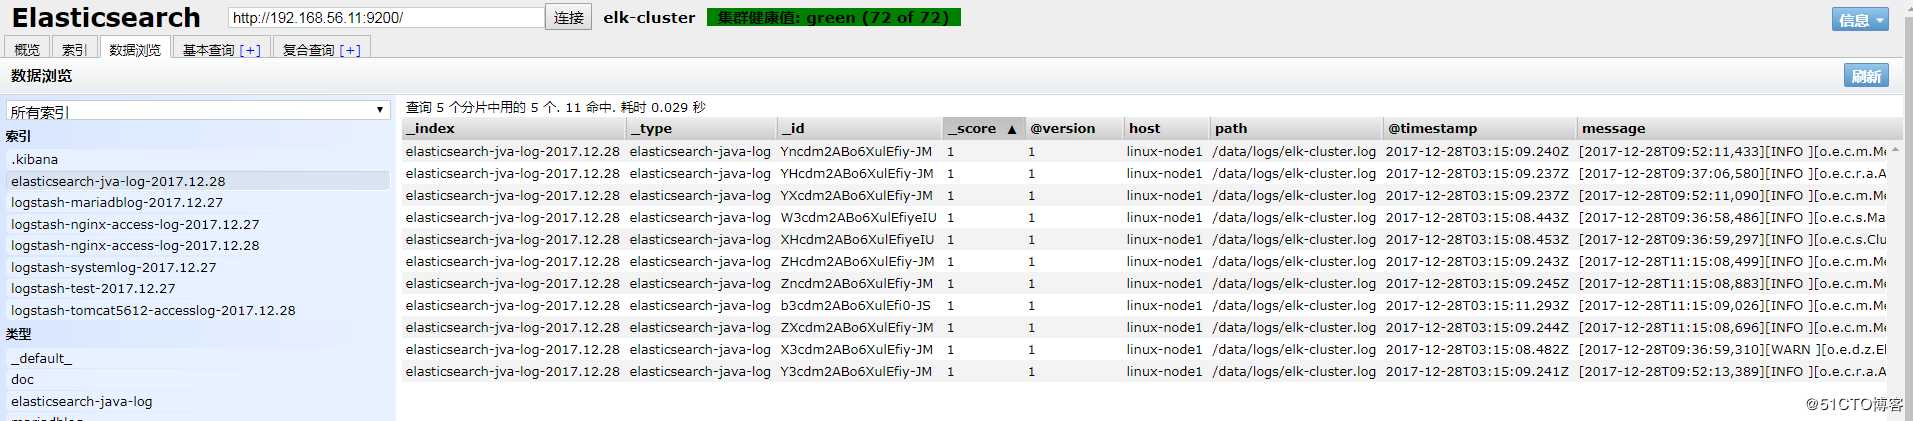
可以看到以“[”开头的信息都合并了,如图:
tcp模块的使用场景如下: 有一台服务器A只需要收集一个日志,那么我们就可以不需要在这服务器上安装logstash,我们通过在其他logstash上启用tcp模块,监听某个端口,然后我们在这个服务器A把日志通过nc发送到logstash上即可。
[root@linux-node2 ~]# cat /etc/logstash/conf.d/tcp.conf
input {
    tcp{
        port => "5600"    #监听5600端口
        mode => "server"   #模式为server
        type => "tcplog"     #类型为tcplog
    }
}

output {
    stdout {
        codec => rubydebug
    }
}

#检测配置文件语法:
[root@linux-node2 conf.d]# /usr/share/logstash/bin/logstash -f /etc/logstash/conf.d/tcp.conf -t
OpenJDK 64-Bit Server VM warning: If the number of processors is expected to increase from one, then you should configure the number of parallel GC threads appropriately using -XX:ParallelGCThreads=N
WARNING: Could not find logstash.yml which is typically located in $LS_HOME/config or /etc/logstash. You can specify the path using --path.settings. Continuing using the defaults
Could not find log4j2 configuration at path /usr/share/logstash/config/log4j2.properties. Using default config which logs errors to the console
Configuration OK

#node1节点上安装nc命令,并发送日志到node2。Netcat简称nc,在网络工具中具有“瑞士×××”美誉,其功能实用,是一个简单,可靠的网络工具,可通过TCP或UDP协议传输读写数据,另外还具有很多其他功能。
[root@linux-node1 ~]# yum install -y nc
#通过nc来发送日志
[root@linux-node1 ~]# echo "hello world" | nc 192.168.56.12 5600

#linux-node2终端上查看日志输出信息:
[root@linux-node2 conf.d]# /usr/share/logstash/bin/logstash -f /etc/logstash/conf.d/tcp.conf
OpenJDK 64-Bit Server VM warning: If the number of processors is expected to increase from one, then you should configure the number of parallel GC threads appropriately using -XX:ParallelGCThreads=N
WARNING: Could not find logstash.yml which is typically located in $LS_HOME/config or /etc/logstash. You can specify the path using --path.settings. Continuing using the defaults
Could not find log4j2 configuration at path /usr/share/logstash/config/log4j2.properties. Using default config which logs errors to the console
{
    "@timestamp" => 2018-01-02T00:59:49.356Z,
          "port" => 57902,
      "@version" => "1",
          "host" => "linux-node1",
      "@metdata" => {
        "ip_address" => "192.168.56.11"
    },
       "message" => "hello world",
          "type" => "tcplog"
}
#可以看到linux-node2上有监听5600端口
[root@linux-node2 ~]# netstat -tunlp |grep 5600
tcp6       0      0 :::5600                 :::*                    LISTEN      2301/java

#还可以将某个文件发送到nc
[root@linux-node1 ~]# nc 192.168.56.12 5600 < /etc/passwd
[root@linux-node2 conf.d]# /usr/share/logstash/bin/logstash -f /etc/logstash/conf.d/tcp.conf
OpenJDK 64-Bit Server VM warning: If the number of processors is expected to increase from one, then you should configure the number of parallel GC threads appropriately using -XX:ParallelGCThreads=N
WARNING: Could not find logstash.yml which is typically located in $LS_HOME/config or /etc/logstash. You can specify the path using --path.settings. Continuing using the defaults
Could not find log4j2 configuration at path /usr/share/logstash/config/log4j2.properties. Using default config which logs errors to the console
    "@timestamp" => 2018-01-02T01:00:54.530Z,
          "port" => 58134,
      "@version" => "1",
          "host" => "linux-node1",
      "@metdata" => {
        "ip_address" => "192.168.56.11"
    },
       "message" => "root:x:0:0:root:/root:/bin/bash",
          "type" => "tcplog"
}
{
    "@timestamp" => 2018-01-02T01:00:54.531Z,
          "port" => 58134,
      "@version" => "1",
          "host" => "linux-node1",
      "@metdata" => {
        "ip_address" => "192.168.56.11"
    },
       "message" => "bin:x:1:1:bin:/bin:/sbin/nologin",
          "type" => "tcplog"
}
......

#也可以通过这种方式伪设备的方式发送日志:(在类unix操作系统中,设备节点并一定要对应物理设备。没有这种对应关系的设备是伪设备。操作系统运用了它们提供的多种功能,tcp只是dev下面众多伪设备当中的一种设备。)

[root@linux-node1 ~]# echo "222" > /dev/tcp/192.168.56.12/5600
[root@linux-node2 conf.d]# /usr/share/logstash/bin/logstash -f /etc/logstash/conf.d/tcp.conf
OpenJDK 64-Bit Server VM warning: If the number of processors is expected to increase from one, then you should configure the number of parallel GC threads appropriately using -XX:ParallelGCThreads=N
WARNING: Could not find logstash.yml which is typically located in $LS_HOME/config or /etc/logstash. You can specify the path using --path.settings. Continuing using the defaults
Could not find log4j2 configuration at path /usr/share/logstash/config/log4j2.properties. Using default config which logs errors to the console
{
    "@timestamp" => 2018-01-02T01:26:55.922Z,
          "port" => 35576,
      "@version" => "1",
          "host" => "linux-node1",
      "@metdata" => {
        "ip_address" => "192.168.56.11"
    },
       "message" => "222",
          "type" => "tcplog"
}
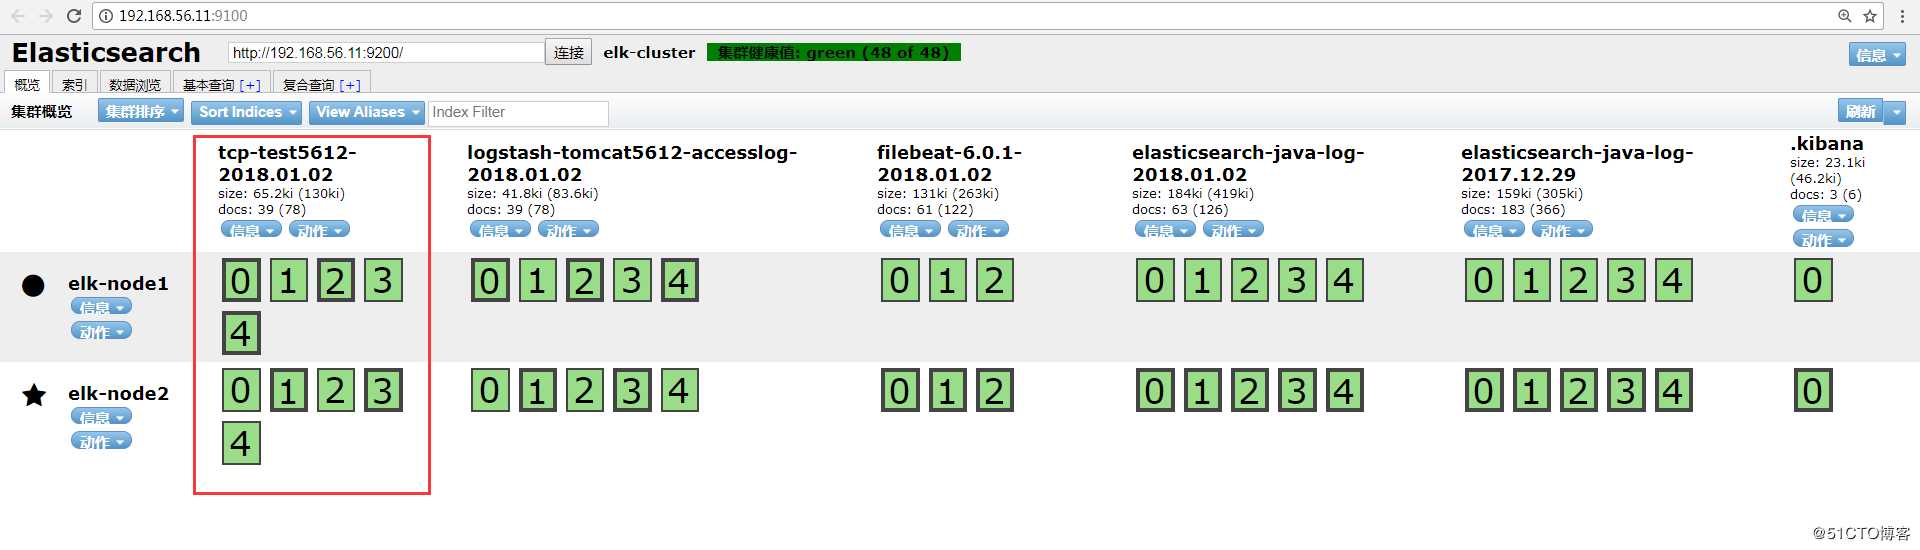
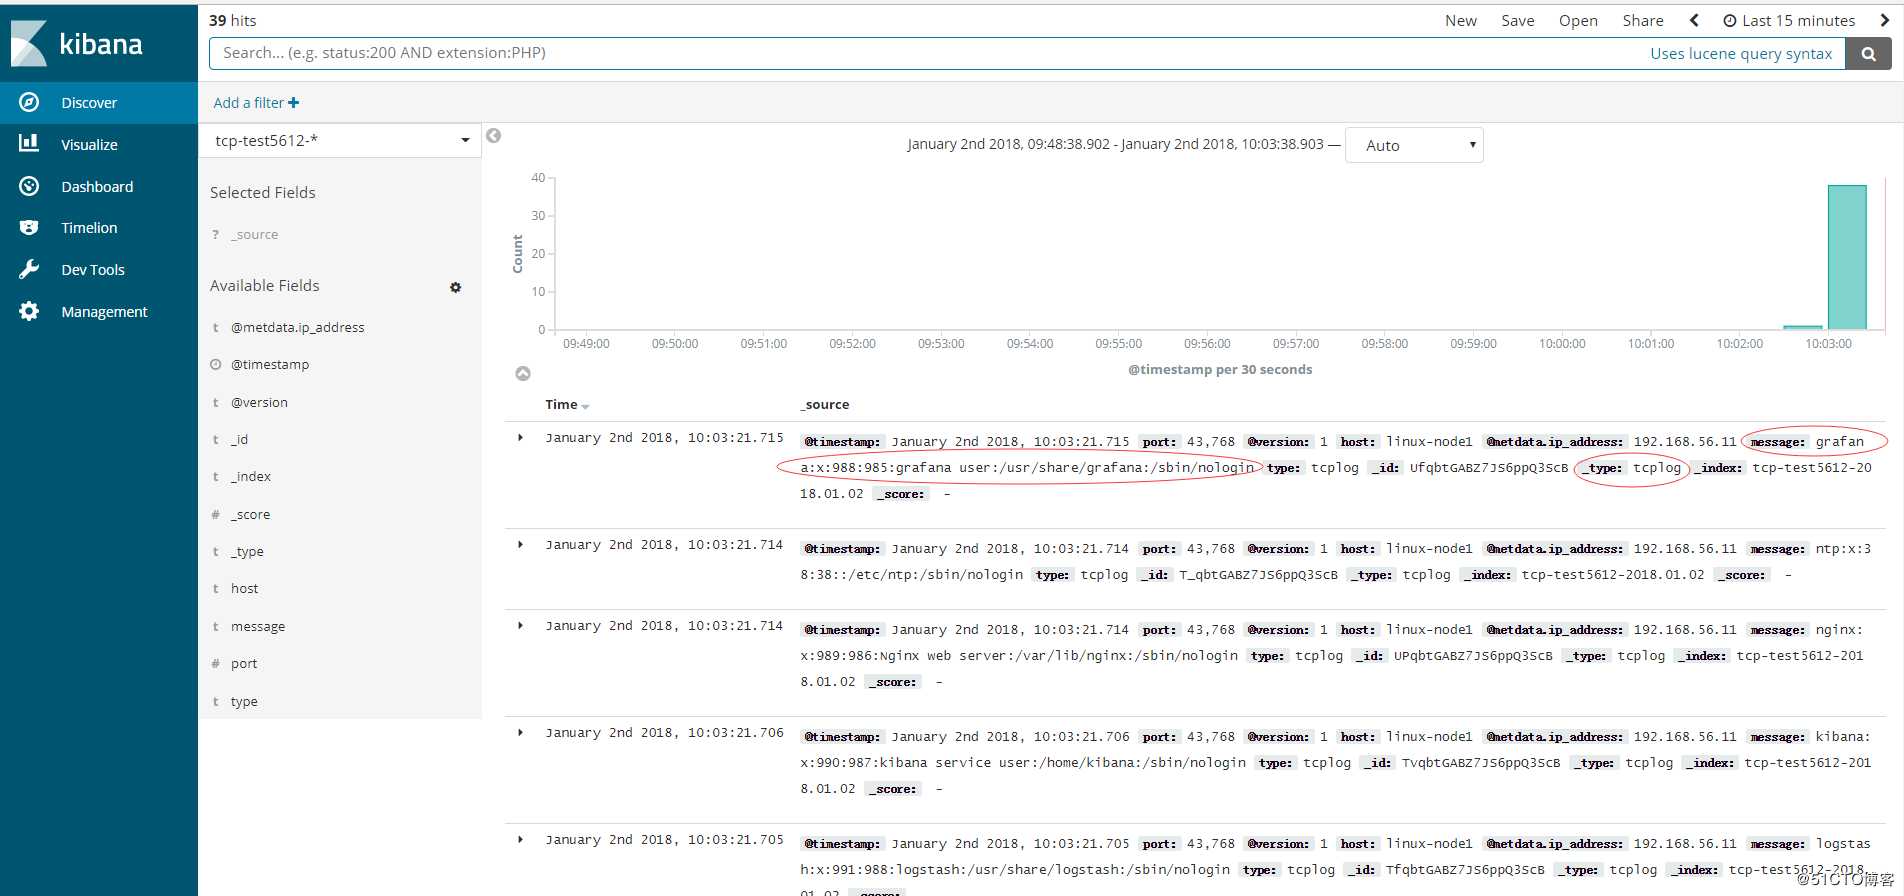
[root@linux-node2 conf.d]# vim tcp.conf
input {
        tcp{
                port => "5600"
                mode => "server"
                type => "tcplog"
        }
}

output {
        elasticsearch {
                hosts => ["192.168.56.11:9200"]
                index => "tcp-test5612-%{+YYYY.MM.dd}"
        }
        file {
                path => "/tmp/tcp-test5612-%{+YYYY.MM.dd}"
        }
}

[root@linux-node2 conf.d]# /usr/share/logstash/bin/logstash -f /etc/logstash/conf.d/tcp.conf -t
OpenJDK 64-Bit Server VM warning: If the number of processors is expected to increase from one, then you should configure the number of parallel GC threads appropriately using -XX:ParallelGCThreads=N
WARNING: Could not find logstash.yml which is typically located in $LS_HOME/config or /etc/logstash. You can specify the path using --path.settings. Continuing using the defaults
Could not find log4j2 configuration at path /usr/share/logstash/config/log4j2.properties. Using default config which logs errors to the console
Configuration OK
[root@linux-node2 conf.d]# systemctl restart logstash
[root@linux-node1 elasticsearch-head]# echo "hello world" |nc 192.168.56.12 5600
[root@linux-node1 elasticsearch-head]# nc 192.168.56.12 5600 < /etc/passwd
HEAD插件查看:
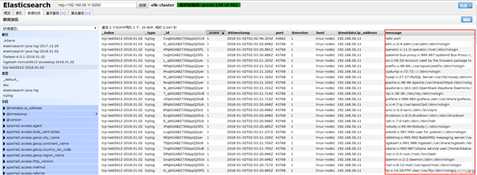
Kibana添加索引查看:
ELK实战之Nginx、Tomcat、Java日志收集以及TCP收集日志使用
标签:插件 log4j2 erro path test 日志 templates 实用 iso
原文地址:https://www.cnblogs.com/linuxk/p/9273160.html
