标签:reg pyplot 元素 int import 相等 size sigma 1.9

 1 import numpy as np
 2 import matplotlib.pyplot as mp
 3 x = np.array([
 4     [3, 1],
 5     [2, 5],
 6     [1, 8],
 7     [6, 4],
 8     [5, 2],
 9     [3, 5],
10     [4, 7],
11     [4, -1]])
12 y = np.array([0, 1, 1, 0, 0, 1, 1, 0])
13
14 # X[:,0]是numpy中数组的一种写法,表示对一个二维数组,取该二维数组第一维中的所有数据,第二维中取第0个数据,直观来说,X[:,0]就是取所有行的第0个数据,
15 # X[:,1] 就是取所有行的第1个数据。
16 l, r, h = x[:, 0].min() - 1, x[:, 0].max() + 1, 0.005
17 b, t, v = x[:, 1].min() - 1, x[:, 1].max() + 1, 0.005
18 # meshgrid()根据传入的两个一维数组参数生成两个数组元素的列表
19 grid_x = np.meshgrid(np.arange(l, r, h), np.arange(b, t, v))
20 # 做列拼接
21 # np.c_是按行连接两个矩阵,就是把两矩阵左右相加,要求行数相等,类似于pandas中的merge()
22 flat_x = np.c_[grid_x[0].ravel(), grid_x[1].ravel()]
23 flat_y = np.zeros(len(flat_x), dtype=int)
24
25 flat_y[flat_x[:, 0] < flat_x[:, 1]] = 1
26 grid_y = flat_y.reshape(grid_x[0].shape)
27
28
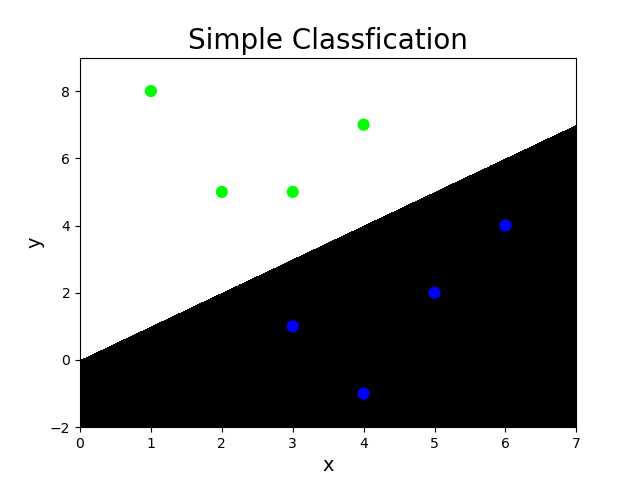
29 mp.figure(‘Simple Classfication‘, facecolor=‘lightgray‘)
30 mp.title(‘Simple Classfication‘, fontsize=20)
31 mp.xlabel(‘x‘, fontsize=14)
32 mp.ylabel(‘y‘, fontsize=14)
33 mp.tick_params(labelsize=10)
34 # 用颜色绘制网格
35 mp.pcolormesh(grid_x[0], grid_x[1], grid_y, cmap=‘gray‘)
36 mp.scatter(x[:, 0], x[:, 1], c=y, cmap=‘brg‘, s=60)
37 mp.show()

J(k1,k2,b) = sigma(-ylog(y‘)-(1-y)log(1-y‘))/m +m正则函数(||k1,k2,b||)x正则强度
接口:
sklearn.linear_model.LogisticRegression(solver=‘liblinear‘, C=正则强度)

 1 import numpy as np
 2 import sklearn.linear_model as lm
 3 import matplotlib.pyplot as mp
 4 x = np.array([
 5     [4, 7],
 6     [3.5, 8],
 7     [3.1, 6.2],
 8     [0.5, 1],
 9     [1, 2],
10     [1.2, 1.9],
11     [6, 2],
12     [5.7, 1.5],
13     [5.4, 2.2]])
14 y = np.array([0, 0, 0, 1, 1, 1, 2, 2, 2])
15 # 创建逻辑分类器
16 model = lm.LogisticRegression(solver=‘liblinear‘,
17                               C=1000)
18 model.fit(x, y)
19 l, r, h = x[:, 0].min() - 1, x[:, 0].max() + 1, 0.005
20 b, t, v = x[:, 1].min() - 1, x[:, 1].max() + 1, 0.005
21 grid_x = np.meshgrid(np.arange(l, r, h),
22                      np.arange(b, t, v))
23 flat_x = np.c_[grid_x[0].ravel(), grid_x[1].ravel()]
24 flat_y = model.predict(flat_x)
25 grid_y = flat_y.reshape(grid_x[0].shape)
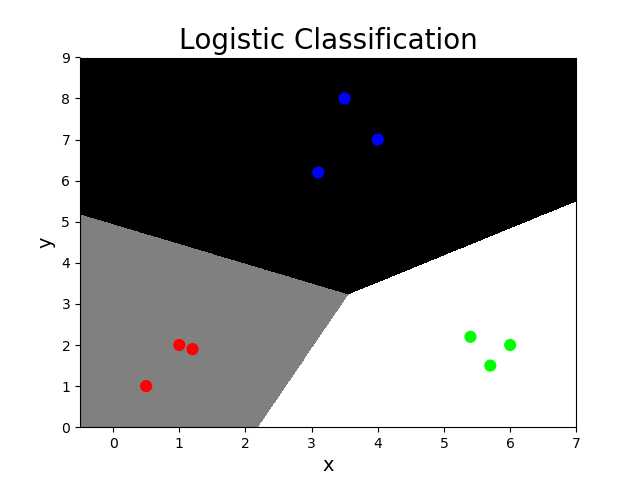
26 mp.figure(‘Logistic Classification‘,
27           facecolor=‘lightgray‘)
28 mp.title(‘Logistic Classification‘, fontsize=20)
29 mp.xlabel(‘x‘, fontsize=14)
30 mp.ylabel(‘y‘, fontsize=14)
31 mp.tick_params(labelsize=10)
32 mp.pcolormesh(grid_x[0], grid_x[1], grid_y, cmap=‘gray‘)
33 mp.scatter(x[:, 0], x[:, 1], c=y, cmap=‘brg‘, s=60)
34 mp.show()

标签:reg pyplot 元素 int import 相等 size sigma 1.9
原文地址:https://www.cnblogs.com/qinhao2/p/9397806.html