码迷,mamicode.com
首页 > 数据库 > 详细

adb shell top 使用

时间:2018-08-03 21:21:04      阅读:295      评论:0      收藏:0      [点我收藏+]

标签:bubuko   应用   cpu占用率   调度   相关   spl   delay   show   cond   

adb shell top 

一、其中相关参数:

  1. >adb shell top -h
  2.  Usage: top [ -m max_procs ] [ -n iterations ] [ -d delay ] [ -s sort_column ] [-t ] [ -h ]
  3.  -m num Maximum number of processes to display. 最多显示多少个进程
  4.  -n num Updates to show before exiting. 刷新次数
  5.  -d num Seconds to wait between updates. 刷新间隔时间(默认5秒)
  6.  -s col Column to sort by (cpu,vss,rss,thr). 按哪列排序
  7.  -t Show threads instead of processes. 显示线程信息而不是进程
  8.  -h Display this help screen. 显示帮助文档

比如:

adb shell top -m  5

技术分享图片

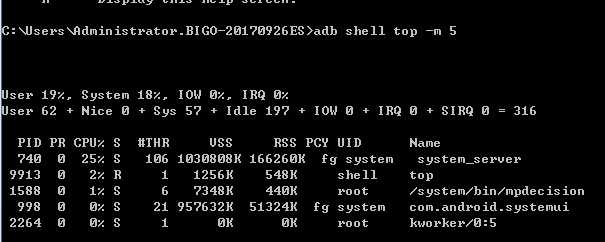
表示打印出5个进程数,以及相关进程运行所消耗的CPU值百分比。

第一栏相关参数解释:

  1. User 处于用户态的运行时间,不包含优先值为负进程
  2.  Nice 优先值为负的进程所占用的CPU时间
  3.  Sys 处于核心态的运行时间
  4.  Idle 除IO等待时间以外的其它等待时间
  5.  IOW IO等待时间
  6.  IRQ 硬中断时间
  7.  SIRQ 软中断时间PID 进程id

第二栏相关参数解释:

  1. PID 进程id
  2.  PR 优先级
  3.  CPU% 当前瞬时CPU占用率 
  4. S 进程状态:D=不可中断的睡眠状态, R=运行, S=睡眠, T=跟踪/停止, Z=僵尸进程
  5.  #THR 程序当前所用的线程数
  6.  VSS Virtual Set Size 虚拟耗用内存(包含共享库占用的内存)
  7.  RSS Resident Set Size 实际使用物理内存(包含共享库占用的内存)
  8.  PCY 调度策略优先级,SP_BACKGROUND/SP_FOREGROUND
  9.  UID 进程所有者的用户id
  10.  Name 进程的名称

二、命令使用  

  1. adb shell top -m xx  查看XX个进程数
  2. adb shell top -n XX  刷新XX次
  3. adb shell top -d XX  刷新频率
  4. ……

三、打印出来的数据保存到本地

  adb shell top -m 5 > d:\cpu.txt  表示打印的5个进程的数据保存到本地D盘的cpu.txt文件中

四、指定查看某个应用的数据

  例如: 监测一次微博的CPU占用情况:adb shell top -n 1 | grep com.sina.weibo

     10秒刷新一次显示CPU占用情况:adb shell top -d 10 | grep com.sina.weibo

     实时监测微博的CPU占用情况:adb shell top |grep com.sina.weibo

adb shell top 使用

标签:bubuko   应用   cpu占用率   调度   相关   spl   delay   show   cond   

原文地址:https://www.cnblogs.com/Qliupeng/p/9416219.html

(0)
(0)
   
举报
评论 一句话评论(0
登录后才能评论!
© 2014 mamicode.com 版权所有  联系我们:gaon5@hotmail.com
迷上了代码!