onLoad: function (e) {
var windowWidth = 320;
try {
var res = wx.getSystemInfoSync();
windowWidth = res.windowWidth;
} catch (e) {
console.error(‘getSystemInfoSync failed!‘);
}
var simulationData = this.createSimulationData();
lineChart = new wxCharts({
canvasId: ‘lineCanvas‘,//和前面的html中的红色值相对应
type: ‘line‘, //表示是以线为主的图表
categories: simulationData.categories, //表示图表中下边一行显示的的数据 例如:2016年的数量要表达出来。。。 即显示的2016年
animation: true,//是否有动画
// background: ‘#f5f5f5‘,
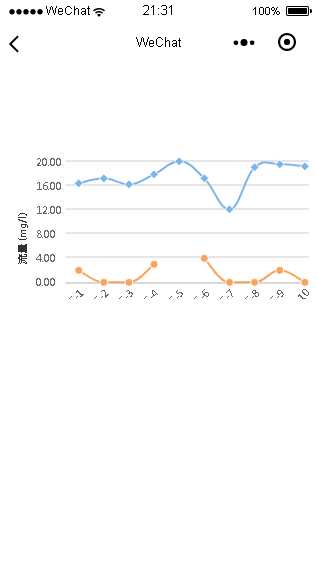
series: [{
name: ‘成交量1‘,
data: simulationData.data,
format: function (val, name) {
return val.toFixed(2) + ‘万‘;
}
}, {
name: ‘成交量2‘,
data: [2, 0, 0, 3, null, 4, 0, 0, 2, 0],
format: function (val, name) {
return val.toFixed(2) + ‘万‘;
}
}],
xAxis: {
disableGrid: true
},
//y轴的标题
yAxis: {
title: ‘流量 (mg/l)‘,//y轴标题的题目
format: function (val) {
return val.toFixed(2);//y轴的数字保留两位小数
},
min: 0
},
width: windowWidth,
height: 200,
dataLabel: false,//所显示出来的曲线上是否显示相应的信息
dataPointShape: true,
extra: {
lineStyle: ‘curve‘//以半圆形的曲线连接起来
}
});
}})
第三
展示结果