标签:imu alt gpl 离散 each image 分类 语言 info
1)条形图
条形图或许是最常用图形,常用来展示分类(different categories on the x-axis)和数值(numeric values on the y-axis)之间的关系。sometimes the bar heights represent counts of cases in the data set, and sometimes they represent values in the data set(有时条形图高度代表数据集中的频数(count),有时候代表数据集中的值(values),这个要牢牢的记在心中,否则会产生疑惑).
1.1)以BOD数据框中的数据为例
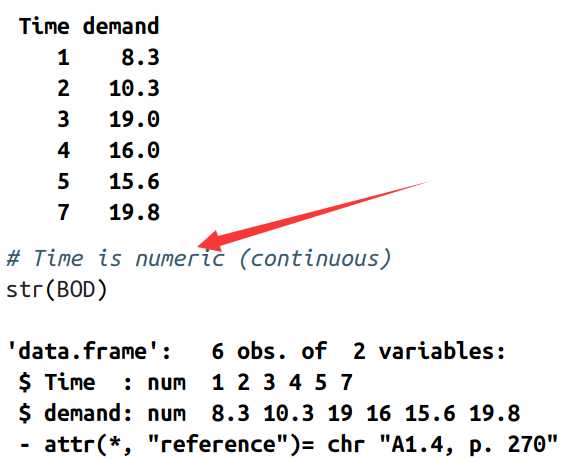
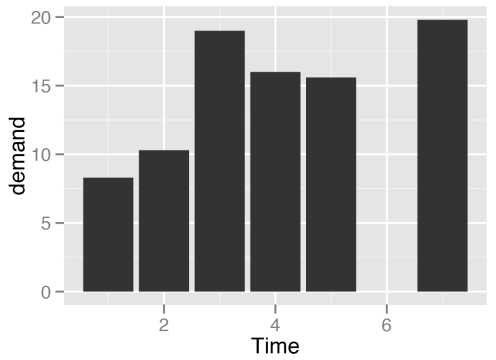
1.2) 当x为(连续型或数字变量):one bar at each possible x value between the minimum and the maximum
ggplot(BOD, aes(x=Time, y=demand)) + geom_bar(stat="identity")
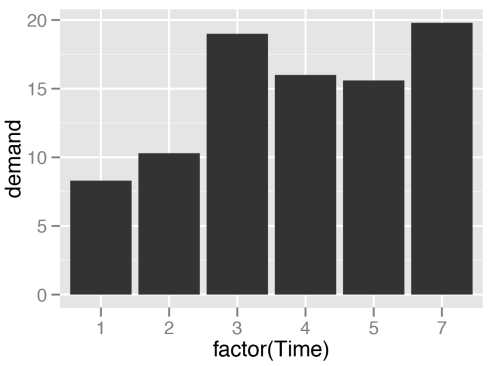
1.3) 当x为分类变量时候:having one bar at each actual x value,
# Convert Time to a discrete (categorical) variable with factor()
ggplot(BOD, aes(x=factor(Time), y=demand)) + geom_bar(stat="identity")
标签:imu alt gpl 离散 each image 分类 语言 info
原文地址:https://www.cnblogs.com/djx571/p/9567191.html