标签:标签 散点图 返回 science 数组 div cat bsp 面向
注:很早之前就打算专门写一篇与Python数据可视化相关的博客,对一些基本概念和常用技巧做一个小结。今天终于有时间来完成这个计划了!
Python在数据科学中的地位,不仅仅是因为numpy, scipy, pandas, scikit-learn这些高效易用、接口统一的科学计算包,其强大的数据可视化工具也是重要组成部分。在Python中,使用的最多的数据可视化工具是matplotlib,除此之外还有很多其他可选的可视化工具包,主要包括以下几大类:
对于数据科学,用的比较多的是matplotlib和seaborn,对数据进行动态或交互式展示时会用到plotly.
Matplotlib是建立在NumPy数组基础上的多平台数据可视化程序库,John Hunter在2002年提出了matplotlib的初步构想——在Python中画出类似MATLAB风格的交互式图形。鉴于此种渊源,类似MATLAB风格的画图接口是matplotlib的两种画图接口之一。这类接口直观、便捷,许多语法与MATLAB类似,也是初学者常用的方式。
这种接口最重要的特性是有状态的(stateful):它会持续跟踪"当前的"图形和坐标轴,所有plt命令都可以应用。可以用plt.gcf()(获取当前图形)和plt.gca()(获取当前坐标轴)来查看具体信息。
matplotlib画图的基本设置:
1 import matplotlib as mpl
2 import matplotlib.pyplot as plt
3 mpl.rcParams[‘axes.linewidth‘] = 1.5 #set the value globally, 设置坐标轴线宽
4 import seaborn as sns
5 sns.set()  # 使用seaborn设置绘图风格
更多自定义设置可以参考官方文档:Customizing matplotlib
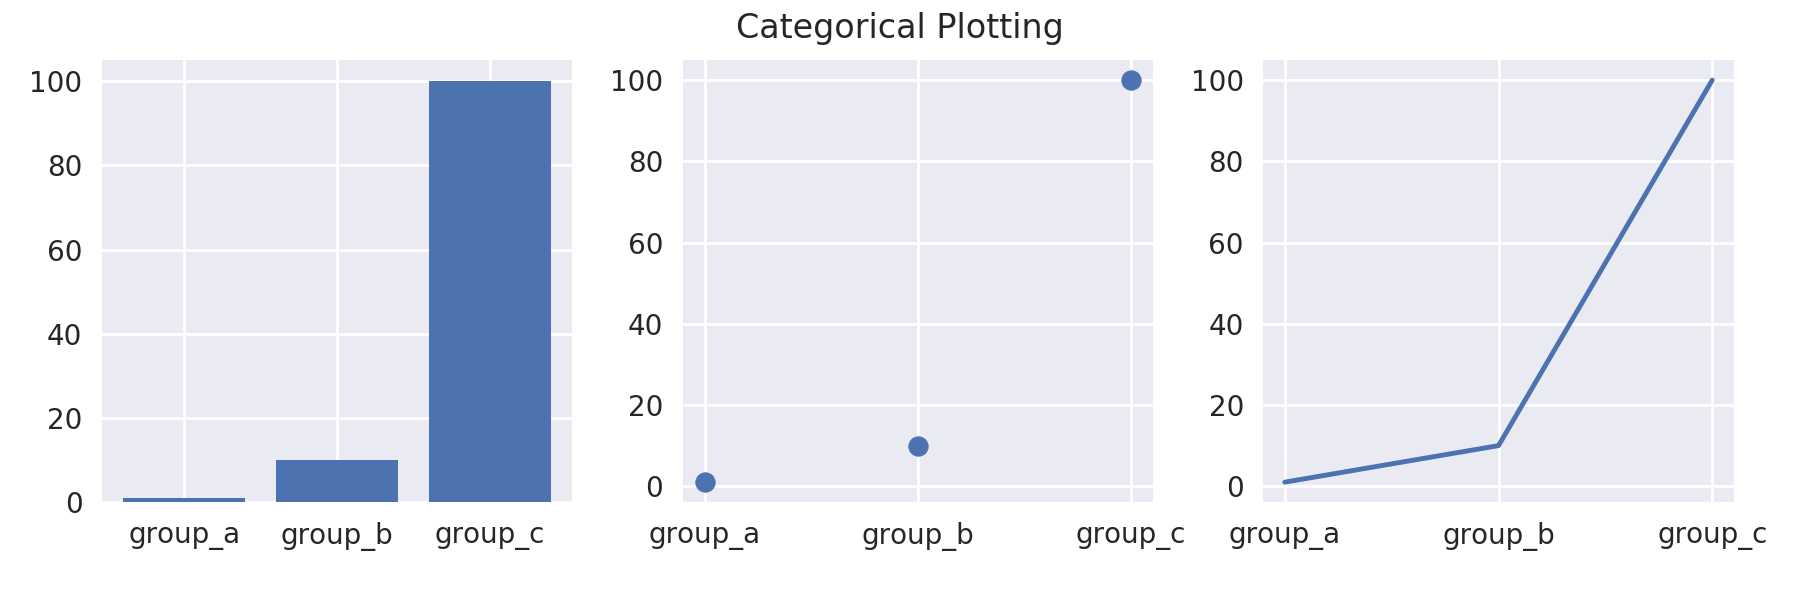
下面使用MATLAB风格画图,对一组分类变量(categorical variables)进行可视化
 1 names = [‘group_a‘, ‘group_b‘, ‘group_c‘]  # 不同分类的名称
 2 values = [1, 10, 100]  # 不同分类对应的值
 3
 4 plt.figure(1, figsize=(9, 3))  # 设置图片大小
 5
 6 plt.subplot(131)  # 1x3, 第一个子图
 7 plt.bar(names, values)  # 柱状图
 8 plt.subplot(132)  # 1x3, 第二个子图
 9 plt.scatter(names, values)  # 散点图
10 plt.subplot(133)  # 1x3, 第三个子图
11 plt.plot(names, values)  # 折线图
12 plt.suptitle(‘Categorical Plotting‘)  # 图片的标题
13 # w_pad设置子图之间的间隔宽度;rect设置整个图像部分(矩形)的左上点坐标和右下点坐标,默认值为[0, 0, 1, 1]
14 plt.tight_layout(w_pad=0.1, rect=[0, 0.03, 1, 0.95])
15 plt.savefig(‘demo1.png‘, dpi=200)  # 保存图片
图片如下:

图1:分类变量的可视化
这种方式画图非常直观,每一步都对"plt"对象有一个特定的操作,画图的过程至上而下,画好之后保存图片。其他命令说明如下:
在官方文档中,这种风格的API被称为"pyplot API".
在面向对象编程中有一句口号:"一切皆对象",Python既然是一种面向对象的编程语言,画图也自然可以使用面向对象的方式。MATLAB风格的画图接口直观易用,但是遇到一些精细操作时,就会比较麻烦。面向对象的画图接口可以适应更复杂的场景,更精细的控制需要展示的图形。
在面向对象接口中,画图函数不再受到当前"活动"图形或坐标轴的限制,而变成了显式的Figure和Axes的方法。在画图的过程中,实际操作的是这两个类的实例:figure和axes.
figure(plt.Figure类的一个实例)可以被看成是一个能够容纳各种坐标轴、图形、文字和标签的容器。axes(plt.Axes类的一个实例)是一个带有刻度和标签的矩形,最终会包含所有可视化的图形元素。通常使用变量fig表示一个图形实例,用变量ax表示一个坐标轴实例或一组坐标轴实例。
下面是一个使用面向对象的API画图的例子:
 1 import numpy as np
 2 import matplotlib.pyplot as plt
 3 %matplotlib inline
 4
 5 # example data
 6 x = np.arange(0.1, 4, 0.5)
 7 y = np.exp(-x)
 8
 9 #设置error bar的(单侧)长度
10 error = 0.1 + 0.2 * x
11
12 # 使用subplots返回fig和ax实例
13 fig, (ax0, ax1) = plt.subplots(nrows=2, sharex=True, figsize=(8, 6))  # 两个子图,返回两个Axes实例
14
15 # 第一个子图,对称的error bar
16 ax0.errorbar(x, y, yerr=error, fmt=‘-o‘)
17 ax0.set_title(‘variable, symmetric error‘)
18
19 # 分别设置error bar两侧的长度
20 lower_error = 0.4 * error
21 upper_error = error
22 asymmetric_error = [lower_error, upper_error]
23
24 # 第二个子图,不对称的error
25 ax1.errorbar(x, y, xerr=asymmetric_error, fmt=‘o‘)
26 ax1.set_title(‘variable, asymmetric error‘)
27 ax1.set_yscale(‘log‘)
28 fig.tight_layout()
29 fig.savefig(‘demo2.png‘, dpi=200)  # 保存图片
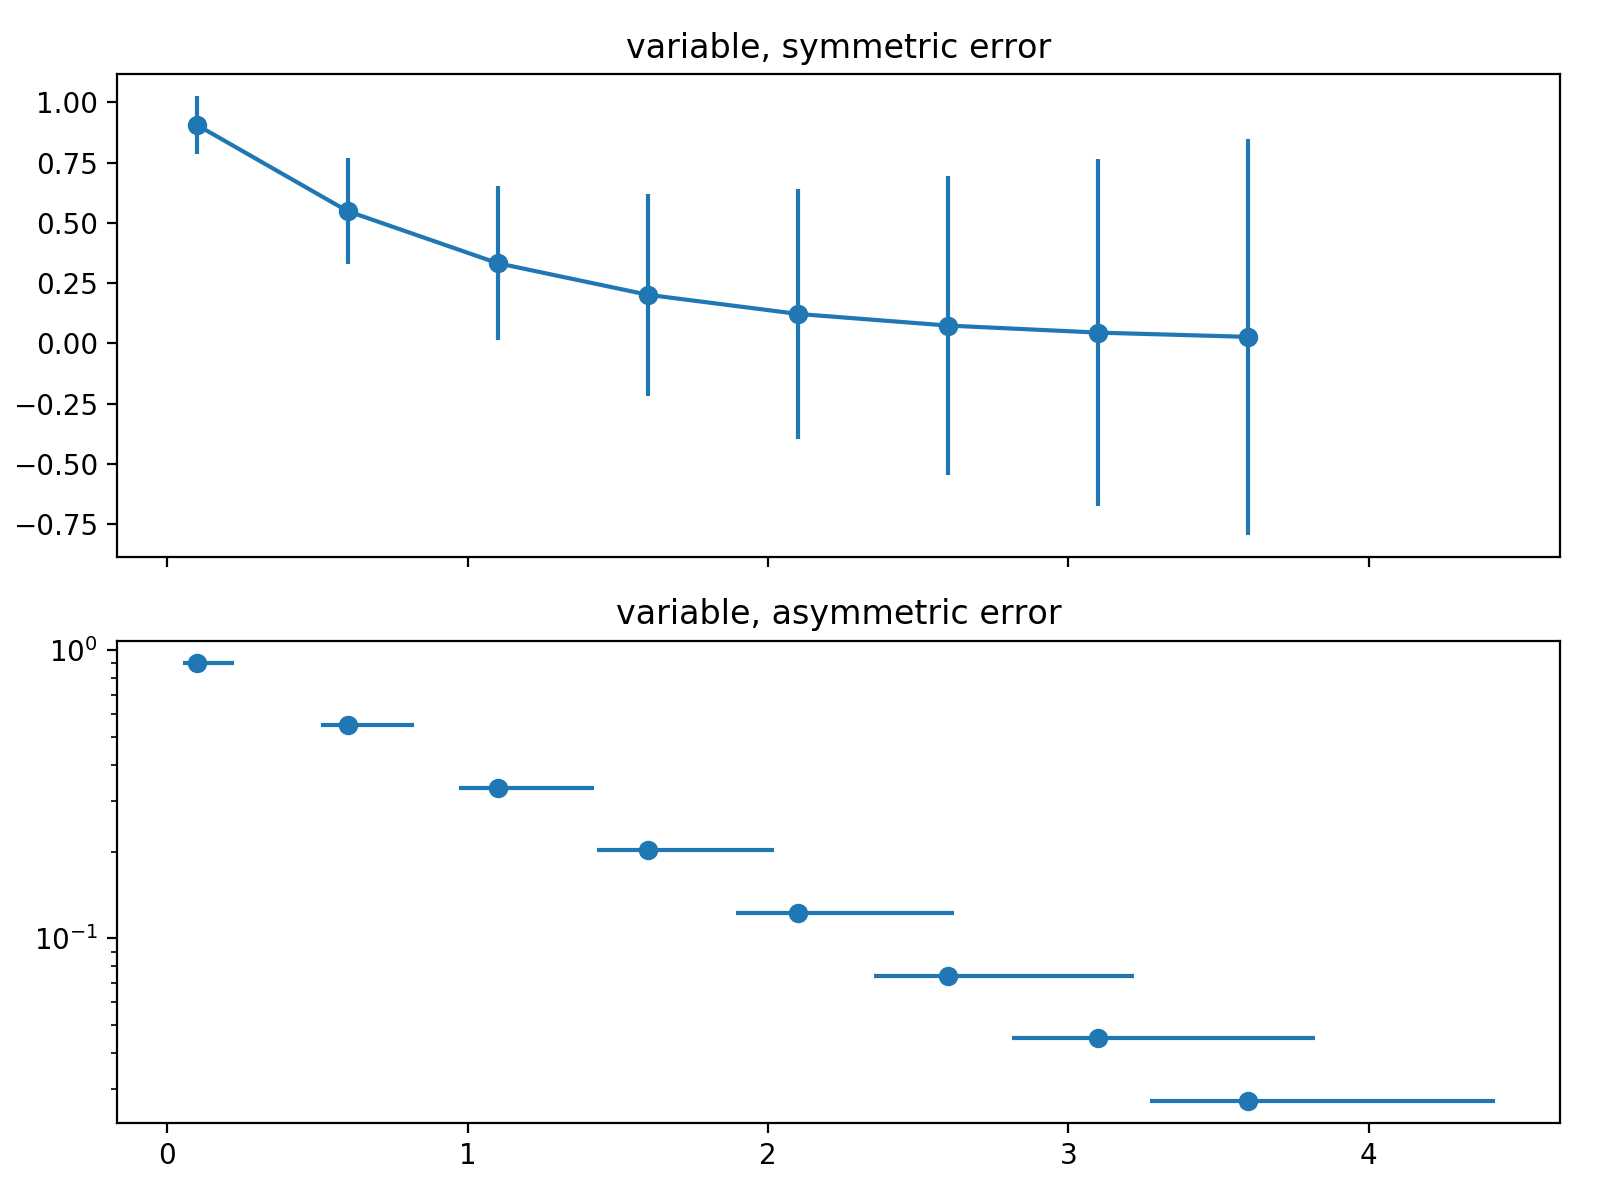
结果如下:

图2:error bar的可视化
如上面的例子显示的那样,可以使用函数plt.subplots()返回fig和ax实例,也可以直接使用plt.Figure和plt.Axes这两个类来返回各自的实例:
 1 import numpy as np
 2 import matplotlib.pyplot as plt
 3 plt.style.use(‘seaborn-whitegrid‘)
 4 %matplotlib inline
 5
 6 fig = plt.figure(figsize=(8, 6))
 7 ax = plt.axes()
 8 x = np.linspace(0, 10, 100)
 9 ax.plot(x, np.sin(x))
10 ax.set_xlabel(‘x‘, size=14)
11 ax.set_ylabel(‘sin x‘, size=14)
12 ax.set_title(‘sin plot‘, size=16)
13 fig.tight_layout()
14 fig.savefig(‘demo3.png‘, dpi=200)
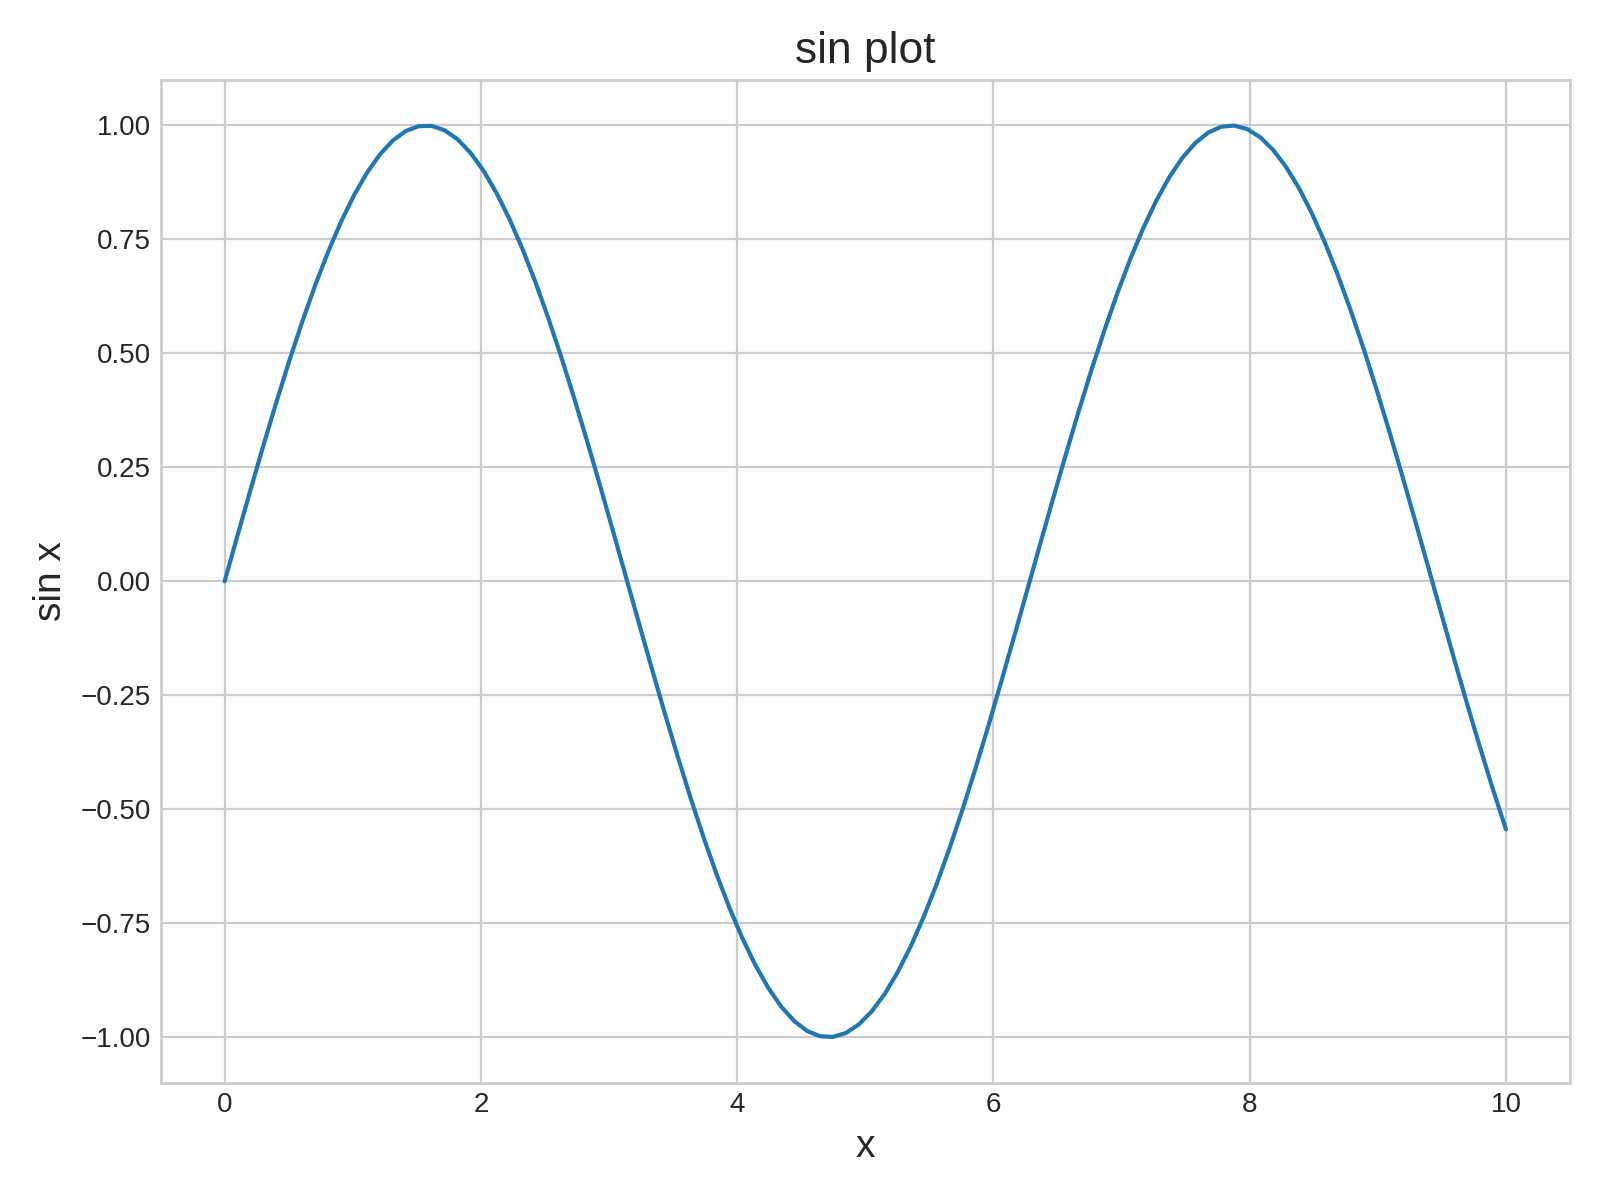
结果如下:

图3:sin函数图像
当我们获取fig和ax实例后,就可以直接操作这两个实例来完成想要可视化效果。操作这两个实例的方法众多,可参考下面的官方文档:
除了matplotlib之外,seaborn是专门为统计制图开发的可视化工具。除了直接用于数据的可视化之外,还能够完成一些常见的统计功能来辅助画图,例如误差线的估计,密度估计,箱形图分位数的计算等。此外,与matplotlib相比,seborn画图的风格更美观。因此该可视化工具在数据分析中也用的比较多。
按照文档中对API的介绍,seaborn主要将统计制图分为下面几类:
使用seaborn画图的例子可以参考:Example gallery
上面例子中涉及到两次对画图风格的设置,风格主要包括对图的配色,背景色、坐标轴、字体、透明度等的设置。在matplotlib中主要有以下风格可选:
> print(plt.style.available)

#---output---#
[‘dark_background‘, ‘seaborn-notebook‘, ‘seaborn-darkgrid‘, ‘_classic_test‘, ‘ggplot‘, ‘seaborn-bright‘, ‘classic‘,

‘Solarize_Light2‘, ‘fast‘, ‘fivethirtyeight‘, ‘seaborn-dark-palette‘, ‘seaborn‘, ‘tableau-colorblind10‘, ‘seaborn-muted‘,

‘seaborn-whitegrid‘, ‘seaborn-ticks‘, ‘seaborn-dark‘, ‘seaborn-white‘, ‘grayscale‘, ‘seaborn-deep‘, ‘seaborn-poster‘,

‘seaborn-talk‘, ‘seaborn-colorblind‘, ‘bmh‘, ‘seaborn-pastel‘, ‘seaborn-paper‘]
参考上面的Customizing matplotlib链接,各种不同样式的比较可以参考:Matplotlib Style Gallery
matplotlib可以画大部分常见的图,例如柱状图、折线图、饼图、直方图等。
更多详情可以参考:Plotting-basic
https://tonysyu.github.io/raw_content/matplotlib-style-gallery/gallery.html
https://jakevdp.github.io/PythonDataScienceHandbook/
https://seaborn.pydata.org/index.html
https://matplotlib.org/index.html
https://stackoverflow.com/questions/8248467/matplotlib-tight-layout-doesnt-take-into-account-figure-suptitle
标签:标签 散点图 返回 science 数组 div cat bsp 面向
原文地址:https://www.cnblogs.com/Belter/p/9650433.html