标签:dbr png tips 大于 cell ossh 去除 汇总表 roman
——2016天猫双十一美妆数据分析
主要使用了Python中的Pandas库进行数据处理,利用matplotlib绘制分析图表,利用bokeh进行了可视化展示。
当前使用版本:Python 3.6.5 |Anaconda, Inc.| (default, Mar 29 2018, 13:32:41) [MSC v.1900 64 bit (AMD64)]
import numpy as np
import pandas as pd
import matplotlib.pyplot as plt
% matplotlib inline
import seaborn as sns

import warnings
warnings.filterwarnings(‘ignore‘)
# 不发出警告

from bokeh.io import output_notebook
output_notebook()
# 导入notebook绘图模块
from bokeh.plotting import figure,show
from bokeh.models import ColumnDataSource
# 导入图表绘制、图标展示模块
# 导入ColumnDataSource模块

import os
# 加载数据
data = pd.read_excel(‘双十一淘宝美妆数据.xlsx‘)

data[data.isnull().values == True].drop_duplicates
# 检查缺失值
data.dtypes
# 查看数据类型

data.index = data[‘update_time‘]
data[‘date‘] = data.index.day
# Series没有.day方法,利用index做了一步转换

data = data.drop(‘update_time‘, axis = 1)
data.reset_index(inplace = True)
data.rename(columns = {‘店名‘: ‘brand‘}, inplace = True)

data.head()

统计商品总数和品牌总数:
data1 = data[[‘id‘,‘title‘, ‘brand‘, ‘price‘, ‘date‘]]

items_num = len(data1[‘id‘].unique())
brands_num = len(data1[‘brand‘].unique())

print(‘商品总数为: %d‘ %items_num)
print(‘品牌总数为: %d‘ %brands_num)
得到商品总数:3502,品牌总数:22
计算双十一当天在售商品占比:
items_at11 = data1[data1[‘date‘] == 11].drop_duplicates()
items_at11_num = len(items_at11)
precentage_11 = items_at11_num / items_num

print(‘双十一当天在售商品占比为: %.2f%%‘ %(precentage_11 * 100))
得到双十一当天在售商品占比为:66.68%,约1/3的商品在双十一当天没有上架
为了分析没参加双十一的产品去向,我们首先对所有商品id依据其上架时间进行分类。
根据date字段,统计每件商品的最早和最迟销售时间;再统计双11当天是否销售;最后进行分类。
# 分析商品最早/最迟销售时间,及双11当天销售情况
data_sellrange = data1.groupby(‘id‘)[‘date‘].agg([‘min‘, ‘max‘])
id_at11 = data1[data1[‘date‘] == 11][‘id‘]

data_temp1 = pd.DataFrame({‘id‘: id_at11, ‘on11sale‘: True})

data1_id = pd.merge(data_sellrange, data_temp1, left_index = True, right_on = ‘id‘, how = ‘left‘)
data1_id.fillna(False, inplace = True)
data1_id[‘type‘] = ‘unclassified‘
data1_id = data1_id.reset_index()
data1_id = data1_id.drop(‘index‘, 1)

data1_id.head()

# 分类
data1_id = data1_id.reset_index()
data1_id = data1_id.drop(‘index‘, 1)

data1_id[‘type‘][(data1_id[‘min‘] < 11) & (data1_id[‘max‘] > 11)] = ‘A‘
data1_id[‘type‘][(data1_id[‘min‘] < 11) & (data1_id[‘max‘] == 11)] = ‘B‘
data1_id[‘type‘][(data1_id[‘min‘] == 11) & (data1_id[‘max‘] > 11)] = ‘C‘
data1_id[‘type‘][(data1_id[‘min‘] == 11) & (data1_id[‘max‘] == 11)] = ‘D‘
data1_id[‘type‘][data1_id[‘on11sale‘] == False] = ‘F‘
# 此时的F还包括E/H的情况
data1_id[‘type‘][data1_id[‘max‘] < 10] = ‘E‘
data1_id[‘type‘][data1_id[‘min‘] > 11] = ‘G‘
data1_id[‘type‘][data1_id[‘max‘] == 10] = ‘H‘

data1_id[data1_id[‘type‘] == ‘unclassified‘]
# 检查分类是否完备

# 分类的可视化
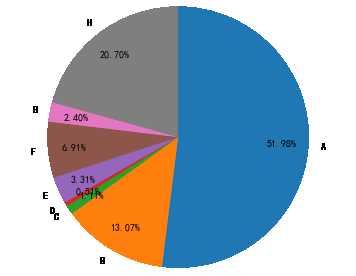
result1 = data1_id[‘type‘].value_counts()
# 用于可视化的数据命名为result
result1 = result1.loc[[‘A‘, ‘B‘, ‘C‘, ‘D‘, ‘E‘, ‘F‘, ‘G‘, ‘H‘]]
# 用于调整Series中Index的顺序

plt.rcParams[‘font.sans-serif‘]=[‘SimHei‘]
# 用来正常显示中文标签
plt.axis(‘equal‘)
# 保证长宽相等 --> 饼图为圆形
plt.pie(result1,labels = result1.index, autopct=‘%.2f%%‘,pctdistance=0.8,labeldistance =1.1,
        startangle=90, radius=1.5,counterclock=False)
# 绘制饼图
# 选择数据字段
id_not11 = data1_id[data1_id[‘on11sale‘] == False]
df_not11 = id_not11[[‘id‘, ‘type‘]]
# 此时没有title字段,需要找到data1合并
data1_not11 = pd.merge(df_not11, data1, how = ‘left‘, on = ‘id‘)
data1_not11.head()

# case1 暂时下架
not11_case1 = data1_not11[data1_not11[‘type‘] == ‘F‘][‘id‘].drop_duplicates()
id_case1 = not11_case1.reset_index().drop(‘index‘, 1)
id_case1[‘case1‘] = 1
# .unique()出现numpy数组,drop_duplicates()返回Series

# case2 更名上架
not11_case2 = data1_not11.groupby([‘id‘, ‘title‘]).count().reset_index()
# 此时聚合的结果为每一个(id - title)对,对应的出现次数,即出现的日期和
title_count = not11_case2[‘id‘].value_counts().reset_index()
# 计算id出现的次数,如果次数大于1,则说明商品更改过title
# reset_index() 使原来index里的信息成为一个新的列
id_case2 = title_count[title_count[‘id‘] > 1][[‘index‘]]
id_case2.columns = [‘id‘]
id_case2[‘case2‘] = 1

# case3 预售
not11_case3 = data1_not11[data1_not11[‘title‘].str.contains(‘预售‘)]
id_case3 = not11_case3[‘id‘].drop_duplicates().reset_index().drop(‘index‘, 1)
# .unique() 返回ndarray / .drop_duplicates() 返回Serise
id_case3[‘case3‘] = 1

# case4 未参与活动
not11_case4 = data1_not11[(data1_not11[‘type‘] == ‘E‘) | (data1_not11[‘type‘] == ‘G‘)][‘id‘].drop_duplicates()
id_case4 = not11_case4.reset_index().drop(‘index‘, 1)
id_case4[‘case4‘] = 1

print("未参与双十一当天活动的商品中:\n暂时下架商品的数量为%i个,更名上架商品的数量为%i个,预售商品的数量为%i个,未参与活动商品数量为%i个" %(len(id_case1), len(id_case2), len(id_case3), len(id_case4)))
未参与双十一当天活动的商品中:
暂时下架商品的数量为242个,更名上架商品的数量为110个,预售商品数量为453个,未参与活动商品数量为200个
# 查看没被分类的其他情况
id_not11_left = id_not11[[‘id‘, ‘min‘, ‘max‘, ‘type‘]].reset_index()
id_not11_left = id_not11_left.drop(‘index‘, axis = 1)
#id_not11_left[‘case‘] = ‘‘
id_not11_left = pd.merge(id_not11_left, id_case1, how = ‘left‘, on = ‘id‘)
id_not11_left = pd.merge(id_not11_left, id_case2, how = ‘left‘, on = ‘id‘)
id_not11_left = pd.merge(id_not11_left, id_case3, how = ‘left‘, on = ‘id‘)
id_not11_left = pd.merge(id_not11_left, id_case4, how = ‘left‘, on = ‘id‘)
id_not11_left = id_not11_left.fillna(0)
id_not11_left[‘left‘] = id_not11_left[‘case1‘] + id_not11_left[‘case2‘] + id_not11_left[‘case3‘] + id_not11_left[‘case4‘]
id_not11_others = id_not11_left[id_not11_left[‘left‘] == 0][[‘id‘, ‘min‘, ‘max‘, ‘type‘]]

id_not11_others.head()
# 未纳入分类的商品都是10日下架的,可能于双11当天售罄
# 暂时下架/更名上架/预售 可能互相包含
id_at11 = id_at11.reset_index().drop(‘index‘, 1)
id_presell = id_case3[[‘id‘]]
id_11all = pd.concat([id_at11, id_presell], ignore_index = True)
# 筛选双十一当日在售商品和预售商品id

id_presell[‘presell‘] = True
id_11all[‘11all‘] = True

data1_id = pd.merge(data1_id, id_presell, how = ‘left‘, on = ‘id‘)
data1_id.fillna(False, inplace = True)
data1_id = pd.merge(data1_id, id_11all, how = ‘left‘, on = ‘id‘)
data1_id.fillna(False, inplace = True)

data1_brand = data1[[‘id‘, ‘brand‘]].drop_duplicates()
data1_id = pd.merge(data1_id, data1_brand, on = ‘id‘, how = ‘left‘)
# 合并数据 销售情况 id brand

data1_id.head()

data1_on11sale = data1_id[data1_id[‘on11sale‘] == True]
brand_on11sale = data1_on11sale.groupby(‘brand‘)[‘id‘].count()

data1_presell = data1_id[data1_id[‘presell‘] == True]
brand_presell = data1_presell.groupby(‘brand‘)[‘id‘].count()
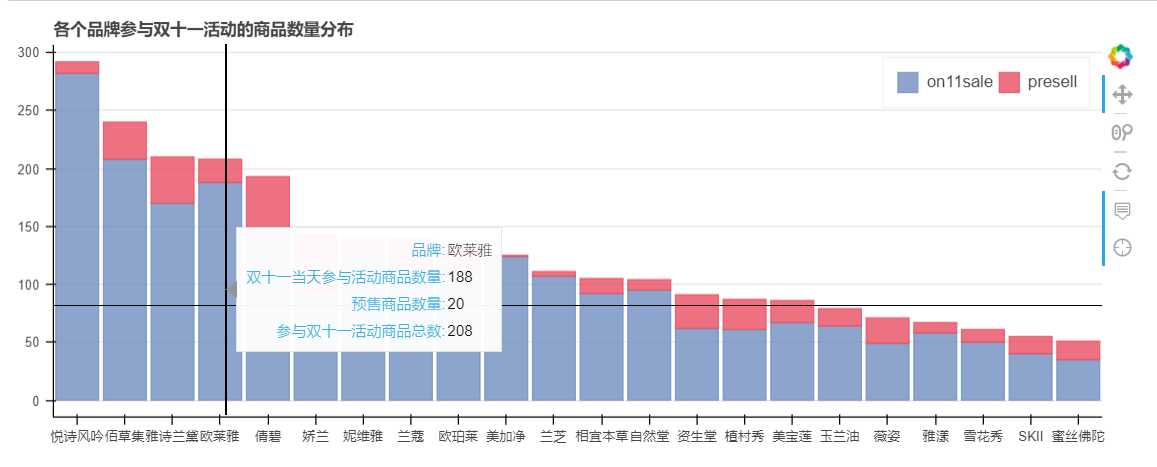
# 统计各品牌双十一当天在售和预售商品数量

# 利用bokeh绘制堆叠图
from bokeh.models import HoverTool
from bokeh.core.properties import value

result2 = pd.DataFrame({‘on11sale‘: brand_on11sale,
                        ‘presell‘: brand_presell})
result2[‘11all‘] = result2[‘on11sale‘] + result2[‘presell‘]
result2.sort_values(by = ‘11all‘, inplace = True, ascending = False)

lst_brand = result2.index.tolist()
lst_type = result2.columns.tolist()[:2]
colors = ["#718dbf" ,"#e84d60"]
# 设置好参数

result2.index.name = ‘brand‘
# 重命名标签
source1 = ColumnDataSource(result2)
# 创建数据

hover1 = HoverTool(tooltips = [(‘品牌‘, ‘@brand‘),
                               (‘双十一当天参与活动商品数量‘, ‘@on11sale‘),
                               (‘预售商品数量‘, ‘@presell‘),
                               (‘参与双十一活动商品总数‘, ‘@11all‘)
                               ])
# 设置标签显示内容
#output_file(‘折扣商品数量.html‘)

p1 = figure(x_range = lst_brand,
            plot_width = 900, plot_height = 350,
            title = ‘各个品牌参与双十一活动的商品数量分布‘,
            tools = [hover1, ‘reset, xwheel_zoom, pan, crosshair‘])
# 构建绘图空间

p1.vbar_stack(stackers = lst_type,
              x = ‘brand‘, source = source1,
              width = 0.9, color = colors, alpha = 0.8,
              legend = [value(x) for x in lst_type],
              muted_color = ‘black‘, muted_alpha = 0.2)
# 绘制堆叠图

p1.xgrid.grid_line_color = None
p1.axis.minor_tick_line_color = None
p1.outline_line_color = None
p1.legend.location = "top_right"
p1.legend.orientation = "horizontal"
p1.legend.click_policy="mute"
# 设置其他参数

show(p1)
data1_brands = result2.copy()
brand_total_item = data1_brand.groupby(‘brand‘).count()
brand_total_item.columns = [‘total_items‘]
data1_brands = pd.merge(data1_brands, brand_total_item, left_index = True, right_index = True, how = ‘outer‘)

data1_brands.head()
| on11sale | presell | 11all | total_items | |
|---|---|---|---|---|
| brand | ||||
| SKII | 40 | 15 | 55 | 62 |
| 佰草集 | 208 | 32 | 240 | 279 |
| 倩碧 | 144 | 49 | 193 | 211 |
| 兰芝 | 107 | 4 | 111 | 156 |
| 兰蔻 | 112 | 27 | 139 | 168 |
1. 针对每个商品,分析其价格变化,判断是否打折
2. 针对在打折商品,计算其折扣率
3. 按照品牌分析,不同品牌的打折力度
4. 分析商家打折套路
data2 = data[[‘id‘, ‘title‘, ‘brand‘, ‘price‘, ‘date‘]]
data2[‘period‘] = pd.cut(data2[‘date‘], [4, 10, 11, 14], labels = [‘双十一前‘, ‘双十一当天‘, ‘双十一后‘])
# 筛选数据

data2_price = data2[[‘id‘, ‘price‘, ‘period‘]].groupby([‘id‘, ‘period‘]).agg([‘min‘, ‘max‘])
data2_price.reset_index(inplace = True)
data2_price.columns = [‘id‘, ‘period‘, ‘min_price‘, ‘max_price‘]
# 找到每个时段对应的最高和最低价格

data2_price_before11 = data2_price[data2_price[‘period‘] == ‘双十一前‘]
# 分析双十一之前的价格变化 --> 分析属于提前降价还是假打折(先涨价后降价)
data2_price_before11_diff = data2_price_before11[data2_price_before11[‘min_price‘] != data2_price_before11[‘max_price‘]].reset_index().drop(‘index‘, 1)
# 找出双十一前价格变化的商品
diff_id = data2_price_before11_diff[‘id‘].tolist()

data2_diffprice = pd.merge(data2, data2_price_before11_diff, on = ‘id‘, how = ‘left‘)
# 与原始数据合并,查看价格变化商品的具体情况
data2_diffpriceonly = data2_diffprice.dropna()
data2_diffpriceonly.drop(‘period_y‘, 1, inplace = True)
# 删除多余的列和缺失值

before11_diff = data2_diffpriceonly[data2_diffpriceonly[‘period_x‘] != ‘双十一后‘].reset_index().drop(‘index‘, 1)
# 只查看双十一之前和当天的数据
before_11diffprice = before11_diff.pivot_table(index = ‘id‘, columns = ‘date‘, aggfunc = {‘price‘:min})
# 数据透视表
before_11diffprice.columns = [5, 6, 7, 8, 9, 10, 11]
# 列名改用数字,不用字符串,方便运算

def function(df, *colnums):
    a = 0
    for colnum in colnums:
        if df[colnum + 1] - df[colnum] > 0.1:
            a = 1
    return a

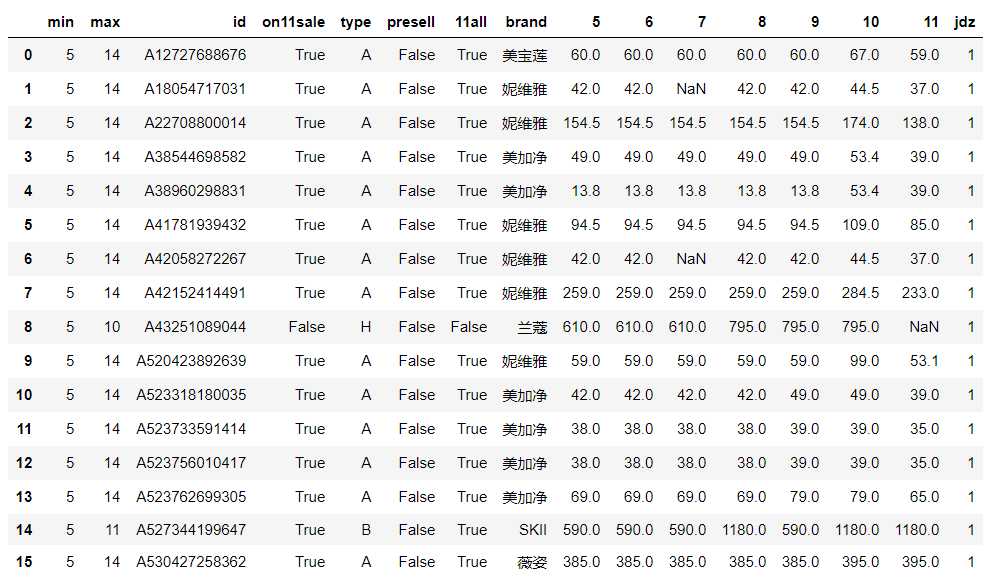
before_11diffprice[‘jdz‘] = before_11diffprice.apply(lambda x: function(x, 5, 6, 7, 8, 9), axis = 1)
# 选择出涨价的商品在假打折列名标注1
# 只统计涨价1毛以上的
# DataFrame.apply函数的应用,如果设置axis参数为1则每次函数每次会取出DataFrame的一行来做处理

jdz_num = before_11diffprice[‘jdz‘].sum()
# 共有16件商品假打折
jdz_items = pd.merge(data1_id, before_11diffprice, on = ‘id‘, how = ‘right‘)
jdz_items = jdz_items[jdz_items[‘jdz‘] == 1]
jdz_items = jdz_items[jdz_items[‘jdz‘] == 1].reset_index().drop(‘index‘, 1)

jdz_id = jdz_items[[‘id‘, ‘jdz‘]]
# 提取假打折商品id

jdz_items
观察数据可知
data2_nocheat = pd.merge(data2, jdz_id, on = ‘id‘, how = ‘left‘)
data2_nocheat[‘jdz‘].fillna(0, inplace = True)
data2_nocheat = data2_nocheat[data2_nocheat.jdz.isin([0])]
# 根据列条件删除行使用.isin(),参数为列表,如选择不包含,前面加负号
# 提取非假打折商品

price = data2_nocheat[[‘id‘, ‘price‘, ‘period‘]].groupby([‘id‘, ‘price‘]).min()
price.reset_index(inplace = True)
# 针对每个商品做price字段的value值统计,查看价格是否有波动

id_count = price[‘id‘].value_counts()
id_type1 = id_count[id_count == 1].index
# 价格无波动,不打折
id_type2 = id_count[id_count != 1].index
# 价格变动

n1 = len(id_type1)
n2 = len(id_type2)
print(‘真打折的商品数量约占比%.2f%%,不打折的商品数量约占比%.2f%%, 假打折的商品数量约占比%.2f%%‘ %       (n2/items_num * 100, n1/items_num * 100, jdz_num/items_num * 100))
# 计算打折商品比例
真打折的商品约占比24.27%,不打折的商品数量约占比75.27%,假打折的商品约占0.46%
result3_pivot = data2_nocheat.pivot_table(index = ‘id‘, columns = ‘period‘, aggfunc = {‘price‘: min})
# 数据透视可以一步到位,省却无数步骤
result3_pivot.columns = [‘price_before11‘, ‘price_on11‘, ‘price_after11‘]
result3_pivot = result3_pivot.reset_index()

nocheat_idbrand = data2_nocheat[[‘id‘, ‘brand‘]].drop_duplicates()
result3_final = pd.merge(result3_pivot, nocheat_idbrand, on = ‘id‘).reset_index().drop(‘index‘, 1)
# 与品牌名合并

result3_final[‘qzkl‘] = result3_final[‘price_on11‘] / result3_final[‘price_before11‘]
result3_final[‘hzkl‘] = result3_final[‘price_on11‘] / result3_final[‘price_after11‘]
# 计算商品的前后折扣率

result3_on11 = result3_final.dropna()
# 筛选出双十一销售商品的折扣率
result3_zk = result3_on11[result3_on11[‘qzkl‘] < 0.96].reset_index()
# 筛选出真打折的商品

result3_zk.head()
| index | id | price_before11 | price_on11 | price_after11 | brand | qzkl | hzkl | |
|---|---|---|---|---|---|---|---|---|
| 0 | 0 | A10027317366 | 188.0 | 159.00 | 258.0 | 相宜本草 | 0.845745 | 0.616279 |
| 1 | 2 | A10847151685 | 180.0 | 125.99 | 240.0 | 佰草集 | 0.699944 | 0.524958 |
| 2 | 8 | A12455538031 | 79.0 | 69.00 | 79.0 | 美宝莲 | 0.873418 | 0.873418 |
| 3 | 26 | A12591129422 | 189.0 | 179.00 | 250.0 | 玉兰油 | 0.947090 | 0.716000 |
| 4 | 35 | A12620798148 | 238.0 | 219.00 | 260.0 | 玉兰油 | 0.920168 | 0.842308 |
## 用bokeh绘制折线图:x轴为折扣率,y轴为商品数量占比
## 商品折扣率统计,每个折扣区间与总打折商品占比
bokeh_data = result3_zk[[‘id‘, ‘qzkl‘]]
bokeh_data[‘zkl_range‘] = pd.cut(bokeh_data[‘qzkl‘], bins = np.linspace(0, 1, 21))
# 创建折扣率区间

bokeh_data2 = bokeh_data.groupby(‘zkl_range‘).count().iloc[:-1]
bokeh_data2[‘zkl_pre‘] = bokeh_data2[‘qzkl‘] / bokeh_data2[‘qzkl‘].sum()
# 将数据按照折扣率拆分为不同区间,并统计不同1扣率的商品数量

bokeh_data2 = bokeh_data2.reset_index().drop(‘id‘, axis = 1)
bokeh_data2.dtypes
# 查看bokeh_data2数据类型,zkl_range类型为category --> str
bokeh_data2[‘zkl_range‘] = bokeh_data2[‘zkl_range‘].astype(str)
# bokeh_data2[‘zkl_range‘] = list(map(str,bokeh_data2[‘zkl_range‘]))

bokeh_data2.head()

#output_file(‘商品折扣率统计折线图.html‘)

source2 = ColumnDataSource(bokeh_data2)
lst_zkl = bokeh_data2[‘zkl_range‘].tolist()
# 此时列表中每个元素均为str

hover2 = HoverTool(tooltips = [(‘折扣商品数量‘, ‘@qzkl‘)])

p2 = figure(x_range = lst_zkl,
            plot_width = 900, plot_height = 350,
            title = ‘商品折扣率统计‘,
            tools = [hover2, ‘reset, xwheel_zoom, pan, crosshair‘])
# 构建绘图空间

p2.line(x = ‘zkl_range‘, y = ‘zkl_pre‘, source = source2,
        line_width = 2, line_alpha = 0.8, line_color = ‘black‘, line_dash = [10, 4])

p2.circle(x = ‘zkl_range‘, y = ‘zkl_pre‘, source = source2,
          size = 8, color = ‘red‘, alpha = 0.8)

p2.xgrid.grid_line_color = None
p2.axis.minor_tick_line_color = None
p2.outline_line_color = None
# 设置其他参数
show(p2)
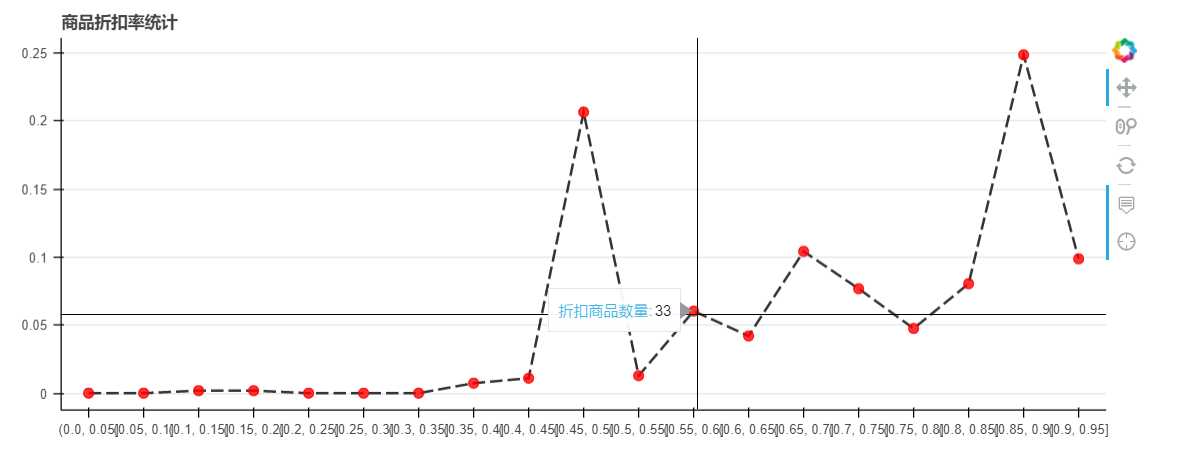
观察上图可知,商品折扣率主要集中在五折和九折,二者共占50%以上
result3_zk[‘zk‘] = 1

# 根据id汇总数据
jdz_merge = jdz_items[[‘id‘, ‘jdz‘]]
result3_zk_merge = result3_zk[[‘id‘, ‘zk‘]]
data2_id = pd.merge(result3_final, jdz_merge, on = ‘id‘, how = ‘outer‘)
data2_id[‘jdz‘].fillna(0, inplace = True)
data2_id = pd.merge(data2_id, result3_zk_merge, on = ‘id‘, how = ‘outer‘)
data2_id[‘zk‘].fillna(0, inplace = True)
# 整理商品id的折扣情况

data1_id = data1_id.drop_duplicates()
# 商品销售情况去重

data_id = pd.merge(data1_id, data2_id, on = ‘id‘, how = ‘outer‘)
data_id.drop(‘brand_y‘, axis = 1, inplace = True)
data_id.rename(columns = {‘min‘: ‘begin‘, ‘max‘: ‘end‘, ‘brand_x‘: ‘brand‘}, inplace = True)
# 汇总商品id的全数据

data_id.head()

brand_zk_num = result3_zk.groupby(‘brand‘)[[‘id‘]].count()
# 品牌折扣商品数
brand_jdz_num = jdz_items.groupby(‘brand‘)[[‘id‘]].count()
# 品牌假打折商品数
brand_zk_num.columns = [‘zk_num‘]
brand_jdz_num.columns = [‘jdz_num‘]
#重命名

brand_zkmean = result3_zk.groupby(‘brand‘)[‘price_before11‘, ‘price_on11‘, ‘price_after11‘, ‘qzkl‘, ‘hzkl‘].mean()
brand_zkmean.columns = [‘zkprice_before11‘, ‘zkprice_on11‘, ‘zkprice_after11‘, ‘qzkl_mean‘, ‘hzkl_mean‘]
# 品牌折扣商品价格、折扣率均值

brand_totalmean = data_id.groupby(‘brand‘)[‘price_before11‘, ‘price_on11‘, ‘price_after11‘].mean()
brand_totalmean.columns = [‘meanprice_before11‘, ‘meanprice_on11‘, ‘meanprice_after11‘]
# 品牌商品价格均值

data2_brands = pd.merge(brand_zk_num, brand_jdz_num, left_index = True, right_index = True, how = ‘outer‘)
data2_brands = pd.merge(data2_brands, brand_totalmean, left_index = True, right_index = True, how = ‘outer‘)
data2_brands.fillna(0, inplace = True)
data2_brands = pd.merge(data2_brands, brand_zkmean, left_index = True, right_index = True, how = ‘outer‘)
# 汇总品牌价格折扣数据

data_brands = pd.merge(data1_brands, data2_brands, left_index = True, right_index = True, how = ‘outer‘)
# 汇总品牌数据

data_brands[‘zk_pre‘] = data_brands[‘zk_num‘] / data_brands[‘total_items‘]
# 计算品牌折扣商品比例

data_brands
from bokeh.transform import jitter

brands = lst_brand.copy()
# 提取品牌列表

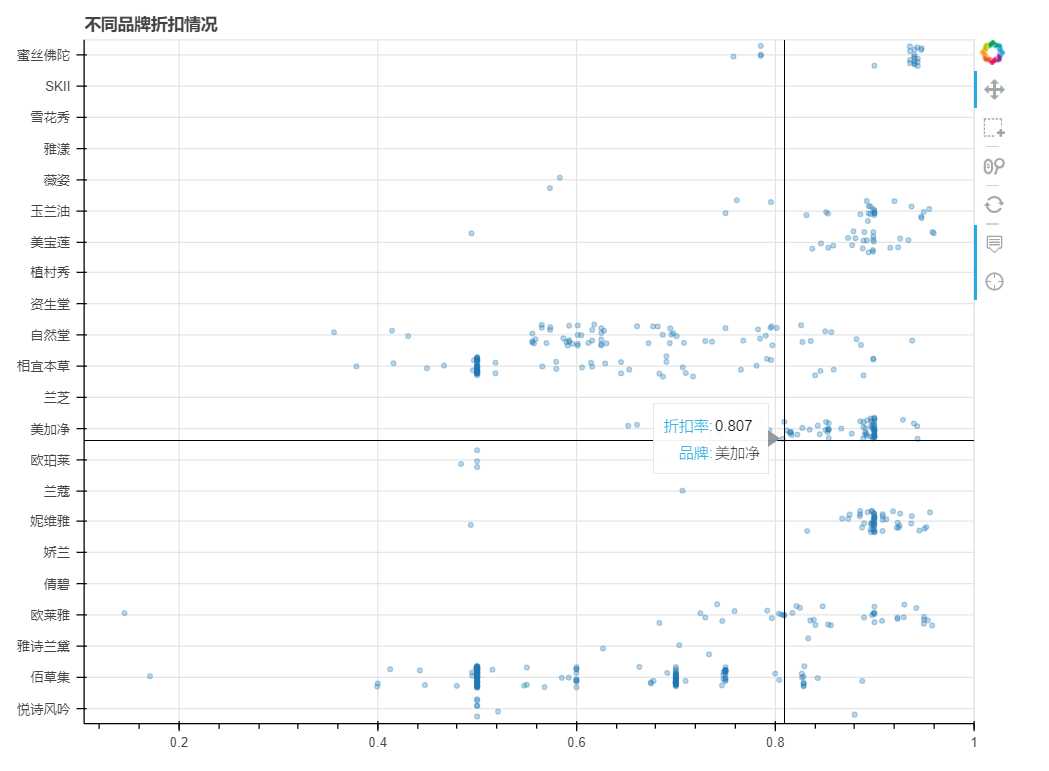
bokeh_data3 = result3_final[[‘id‘, ‘qzkl‘, ‘brand‘]].dropna()
bokeh_data3 = bokeh_data3[bokeh_data3[‘qzkl‘] < 0.96]

source3 = ColumnDataSource(bokeh_data3)
# 创建数据

#output_file(‘不同品牌折扣情况.html‘)

hover3 = HoverTool(tooltips = [(‘折扣率‘, ‘@qzkl‘),
                               (‘品牌‘, ‘@brand‘)])
# 设置标签显示内容

p3 = figure(y_range = brands, plot_width = 800, plot_height = 600,
            title = ‘不同品牌折扣情况‘,
            tools = [hover3, ‘box_select, reset, xwheel_zoom, pan, crosshair‘])

p3.circle(x = ‘qzkl‘,
          y = jitter(‘brand‘, width = 0.7, range = p3.y_range),
          source = source3,
          alpha = 0.3)
# jitter参数 → ‘day‘:第一参数,这里指y的值
# width:间隔宽度比例,range:分类范围对象,这里和y轴的分类一致

show(p3)
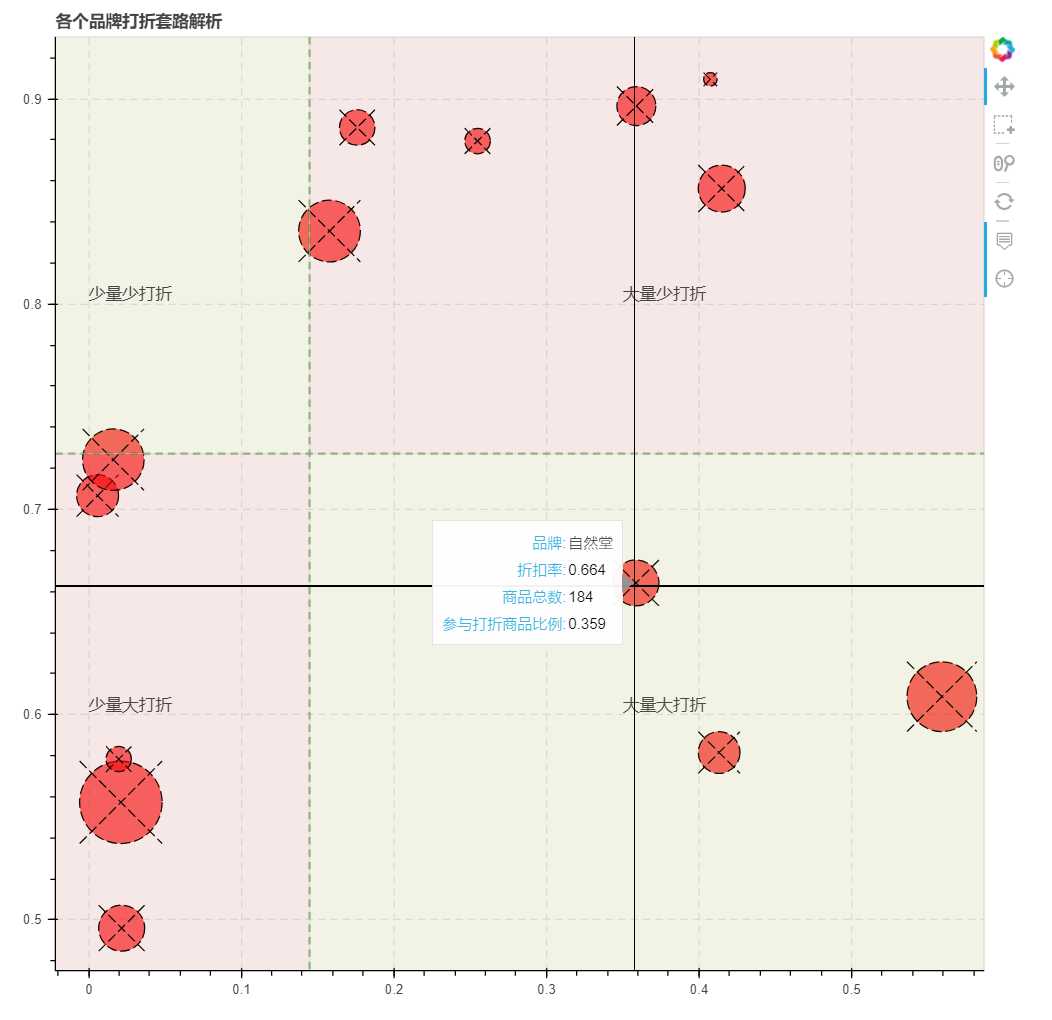
bokeh_data4 = data_brands[[‘total_items‘, ‘qzkl_mean‘, ‘zk_pre‘]]
bokeh_data4[‘size‘] = bokeh_data4[‘total_items‘] * 0.2
bokeh_data4.columns = [‘amount‘, ‘zkl‘, ‘pre‘, ‘size‘]
bokeh_data4.reset_index(inplace = True)
# 筛选出品牌商品总数,打折商品比例,平均折扣率
# 将点的大小设置为与商品总数有关

from bokeh.models.annotations import Span
from bokeh.models.annotations import Label
from bokeh.models.annotations import BoxAnnotation
# 导入注释相关模块

source4 = ColumnDataSource(bokeh_data4)
# 创建ColumnDataSource数据

#output_file(‘各个品牌打折套路解析.html‘)

x_mean = bokeh_data4[‘pre‘].mean()
y_mean = bokeh_data4[‘zkl‘].mean()

hover4 = HoverTool(tooltips = [(‘品牌‘,‘@brand‘),
                              (‘折扣率‘,‘@zkl‘),
                              (‘商品总数‘,‘@amount‘),
                              (‘参与打折商品比例‘,‘@pre‘)])
p4 = figure(plot_width = 800, plot_height = 800,
           title = ‘各个品牌打折套路解析‘,
           tools = [hover4,‘box_select,reset,wheel_zoom,pan,crosshair‘])
# 构建绘图空间

p4.circle_x(x = ‘pre‘, y = ‘zkl‘, source = source4, size = ‘size‘,
           fill_color = ‘red‘, line_color = ‘black‘, fill_alpha =0.6,
           line_dash = [8,3])
p4.ygrid.grid_line_dash = [6,4]
p4.xgrid.grid_line_dash = [6,4]

x = Span(location=x_mean, dimension=‘height‘, line_color=‘green‘,line_alpha = 0.7, line_width=1.5, line_dash = [6,4])
y = Span(location=y_mean, dimension=‘width‘, line_color=‘green‘,line_alpha = 0.7, line_width=1.5, line_dash = [6,4])
p4.add_layout(x)
p4.add_layout(y)
# 绘制辅助线

bg1 = BoxAnnotation(bottom=y_mean, right=x_mean,fill_alpha=0.1, fill_color=‘olive‘)
label1 = Label(x=0.0, y=0.60,text="少量大打折",text_font_size="10pt" )
p4.add_layout(bg1)
p4.add_layout(label1)
# 绘制第一象限

bg2 = BoxAnnotation(bottom=y_mean, left=x_mean,fill_alpha=0.1, fill_color=‘firebrick‘)
label2 = Label(x=0.35, y=0.60,text="大量大打折",text_font_size="10pt" )
p4.add_layout(bg2)
p4.add_layout(label2)
# 绘制第二象限

bg3 = BoxAnnotation(top=y_mean, right=x_mean,fill_alpha=0.1, fill_color=‘firebrick‘)
label3 = Label(x=0.0, y=0.80,text="少量少打折",text_font_size="10pt" )
p4.add_layout(bg3)
p4.add_layout(label3)
# 绘制第三象限

bg4 = BoxAnnotation(top=y_mean, left=x_mean,fill_alpha=0.1, fill_color=‘olive‘)
label4 = Label(x=0.35, y=0.80,text="大量少打折",text_font_size="10pt" )
p4.add_layout(bg4)
p4.add_layout(label4)
# 绘制第四象限

show(p4)
# 商品id资料表格
data_id_ch = data_id.copy()
data_id_ch.columns = [‘最早上架‘, ‘最迟上架‘, ‘商品id‘, ‘双十一当天售卖‘, ‘销售时间分类‘,                      ‘是否预售‘, ‘预售+双11当天‘, ‘品牌‘, ‘双十一前价格‘, ‘双十一当天价格‘,                      ‘双十一之后价格‘, ‘前折扣率‘, ‘后折扣率‘, ‘假打折‘, ‘真打折‘]

data_brands_ch = data_brands.copy()
data_brands_ch.columns = [‘双十一当日商品数‘, ‘预售商品数‘, ‘双十一商品总数‘, ‘商品总数‘,                          ‘真打折商品数‘, ‘假打折商品数‘, ‘双十一前均价‘, ‘双十一当天均价‘,                          ‘双十一之后均价‘, ‘打折商品双十一前均价‘, ‘打折商品双十一均价‘,                          ‘打折商品双十一之后均价‘, ‘平均前折扣率‘, ‘平均后折扣率‘,                          ‘折扣商品占比‘]

jdz_items_ch = jdz_items.copy()
jdz_items_ch.columns = [‘最早上架‘, ‘最迟上架‘, ‘商品id‘, ‘双十一当天售卖‘, ‘销售时间分类‘,                      ‘是否预售‘, ‘预售+双11当天‘, ‘品牌‘, ‘5日价格‘, ‘6日价格‘, ‘7日价格‘,                      ‘8日价格‘, ‘9日价格‘, ‘10日价格‘, ‘11日价格‘, ‘假打折‘]

data_id_ch.to_excel(‘商品id资料表格.xlsx‘)
data_brands_ch.to_excel(‘品牌汇总资料表格.xlsx‘)
jdz_items_ch.to_excel(‘假打折商品详情.xlsx‘)

data_id.to_excel(‘data_id.xlsx‘)
data_brands.to_excel(‘data_brands.xlsx‘)
jdz_items.to_excel(‘jdz_items.xlsx‘)
标签:dbr png tips 大于 cell ossh 去除 汇总表 roman
原文地址:https://www.cnblogs.com/simon95/p/9898800.html