标签:散点图 fonts show idt 折线 影响 style NPU label
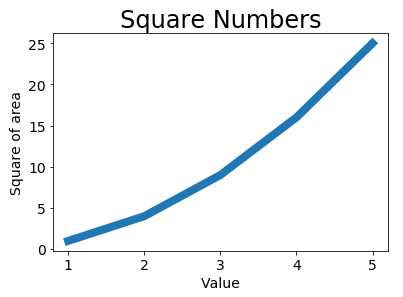
1、折线图
import numpy as np
import matplotlib.pyplot as plt
input_values = [1, 2, 3, 4, 5]
s = [1, 4, 9, 16, 25]
# 图标数据、线条粗细
plt.plot(input_values, s, linewidth=8)
# 定义图表的标题、字体大小
plt.title("Square Numbers", fontsize=24)
plt.xlabel("Value", fontsize=14)
# 定义图表 y轴的标签、字体大小
plt.ylabel("Square of area", fontsize=14)
# tick_params()设置刻度的样式,其中指定的参数将影响
# x轴和y轴上的刻度,并设置刻度标记的字号大小为14
plt.tick_params(axis=‘both‘, labelsize=14)
plt.show()

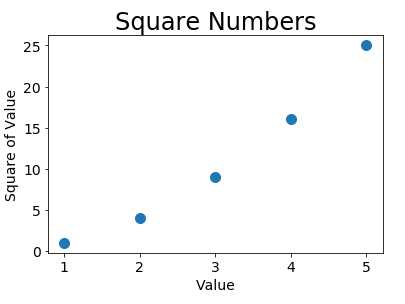
2、绘制散点图
import numpy as np
import matplotlib.pyplot as plt

x_values = [1, 2, 3, 4, 5]
y_values = [1, 4, 9, 16, 25]

plt.scatter(x_values, y_values, s=100)

plt.title("Square Numbers", fontsize=24)
plt.xlabel("Value", fontsize=14)
plt.ylabel("Square of Value", fontsize=14)

plt.tick_params(axis="both", which=‘major‘, labelsize=14)

plt.show()

标签:散点图 fonts show idt 折线 影响 style NPU label
原文地址:https://www.cnblogs.com/yspworld/p/9942120.html