标签:plot min alpha return flag otl pre python att
import numpy as np
from sklearn.datasets import load_iris
iris = load_iris()
x = iris.data[:,1]
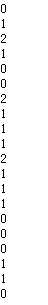
y = np.zeros(150)
def initcenter(x,k): #初始聚类中心数组
return x[0:k].reshape(k)
def nearest(kc,i): #数组中的值,与聚类中心最小距离所在类别的索引号
d = (abs(kc-i))
w = np.where(d == np.min(d))
return w[0][0]
def xclassify(x,y,kc):
for i in range(x.shape[0]): #对数组的每个值进行分类,shape[0]读取矩阵第一维度的长度
y[i] = nearest(kc,x[i])
return y
def kcmean(x,y,kc,k): #计算各聚类新均值
l = list(kc)
flag = False
for c in range(k):
print(c)
m = np.where(y == c)
n=np.mean(x[m])
if l[c] != n:
l[c] = n
flag = True #聚类中心发生变化
print(l,flag)
return (np.array(l),flag)
k = 3
kc = initcenter(x,k)
flag = True
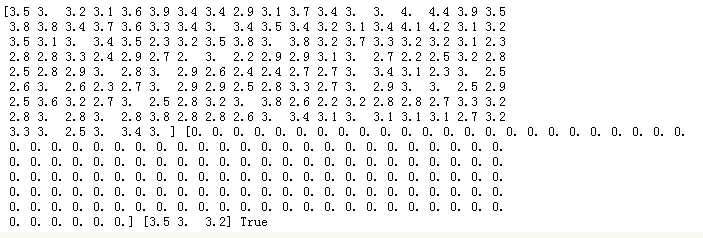
print(x,y,kc,flag)
#判断聚类中心和目标函数的值是否发生改变,若不变,则输出结果,若改变,则返回2
while flag:
y = xclassify(x,y,kc)
kc, flag = kcmean(x,y,kc,k)
print(y,kc,type(kc))
print(x,y)
import matplotlib.pyplot as plt
plt.scatter(x,x,c=y,s=50,cmap="rainbow");
plt.show()

x=np.random.randint(1,100,[20,1]) y=np.zeros(20) k=3 def initcenter(x,k): return x[:k] def nearest(kc,i): d = (abs(kc - i)) w = np.where(d ==np.min(d)) return w [0] [0] kc = initcenter(x,k) nearest(kc,14)

for i in range(x.shape[0]):
    print(nearest(kc,x[i]))
for i in range(x.shape[0]):
    y[i] = nearest(kc,x[i])
print(y)

for i in range(x.shape[0]):
    y[i]=nearest(kc,x[i])
print(y)

def initcenter(x,k):
    return x[:k]

def nearest(kc, i):
    d = (abs(kc - 1))
    w= np.where(d == np.min(d))
    return w[0][0]

def xclassify(x,y,kc):
    for i in range(x.shape[0]):
        y[i] = nearest(kc,x[i])
        return y


kc = initcenter(x,k)
nearest(kc,93)
m = np.where(y == 0)
np.mean(x[m])
kc[0]=24
flag = True
import numpy as np
from sklearn.datasets import load_iris
iris = load_iris()
x = iris.data[:,1]
y = np.zeros(150)


def nearest(kc,i):  #初始聚类中心数组
  return x[0:k]

def  nearest(kc,i):  #数组中的值,与聚类中心最小距离所在类别的索引号
    d = (abs(kc - i))
    w = np.where(d == np.min(d))
    return w[0][0]

def kcmean(x, y, kc, k):  #计算各聚类新均值
    l =list(kc)
    flag = False
    for c in range(k):
        m = np.where(y == c)
        if m[0].shape != (0,):
            n = np.mean(x[m])
            if l[c] != n:
                l[c] = n
                flag = True #聚类中心发生改变
                return (np.array(1),flag)

def xclassify(x,y,kc):
    for i in range(x.shape[0]): #对数组的每个值分类
        y[i] = nearest(kc,x[i])
    return y

k = 3
kc = initcenter(x,k)

falg = True
print(x, y, kc, flag)
while flag:
    y = xclassify(x, y, kc)
    xc, flag = kcmean(x, y, kc, k)

print(y,kc)
import matplotlib.pyplot as plt
plt.scatter(x, x, c=y, s=50, cmap=‘rainbow‘,marker=‘p‘,alpha=0.5);
plt.show()
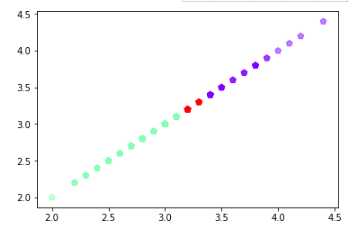
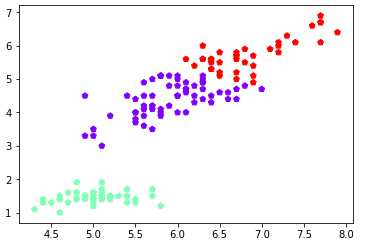
from sklearn.cluster import KMeans
import numpy as np
from sklearn.datasets import load_iris
import matplotlib.pyplot as plt
data = load_iris()
iris = data.data
petal_len = iris
print(petal_len)
k_means = KMeans(n_clusters=3) #三个聚类中心
result = k_means.fit(petal_len) #Kmeans自动分类
kc = result.cluster_centers_ #自动分类后的聚类中心
y_means = k_means.predict(petal_len) #预测Y值
plt.scatter(petal_len[:,0],petal_len[:,2],c=y_means, marker=‘p‘,cmap=‘rainbow‘)
plt.show()
标签:plot min alpha return flag otl pre python att
原文地址:https://www.cnblogs.com/qq279666943/p/9944316.html