标签:support pad figure tran none com 固定 数据可视化 data
Python是动态的,面向对象的脚本语言,最初主要用在自动化脚本的编写,而如今随着Python语言的发展,也逐渐被用在开发中大型项目。 越来越多的程序员开始使用该语言,说明它有着无与伦比的优势,下面就用两个简单的例子来体会一下Python的精妙之处:
1,利用Python编写简单的程序来计算pi
 1 from random import random  //导入随机函数库
 2 Area=1000*1000        //设置随机区域
 3 hits=0             //初始化计数值
 4 for i in range(1,Area+1):  //蒙特卡洛算法
 5         x,y=random(),random()
 6         dist=pow(x**2+y**2,0.5)
 7         if dist<=1.0:
 8                 hits=hits+1
 9 pi=4*(hits/Area)
10 print("圆周率值:{}".format(pi))

从上述例子我们大致观察容易看出 :变量不必定义可以直接使用,这极大方便了程序的编写,尽可能避免了数据的溢出。另一个就是输出格式简单、固定。更深刻的感悟可以通过深入学习
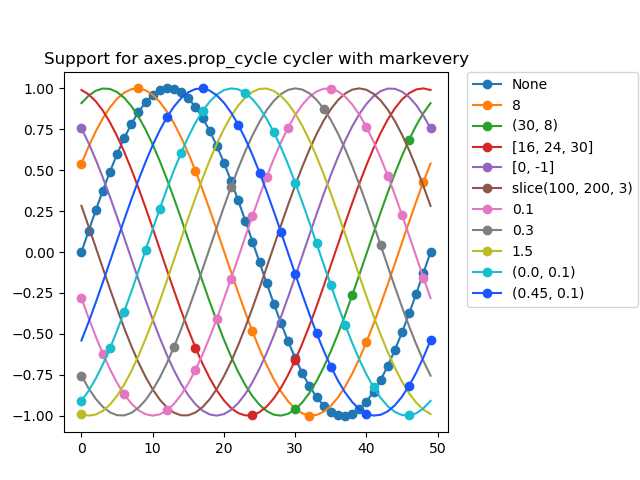
2,利用Python来进行二维数据可视化
from cycler import cycler
import numpy as np
import matplotlib as mpl
import matplotlib.pyplot as plt

# Define a list of markevery cases and color cases to plot
cases = [None,
         8,
         (30, 8),
         [16, 24, 30],
         [0, -1],
         slice(100, 200, 3),
         0.1,
         0.3,
         1.5,
         (0.0, 0.1),
         (0.45, 0.1)]

colors = [‘#1f77b4‘,
          ‘#ff7f0e‘,
          ‘#2ca02c‘,
          ‘#d62728‘,
          ‘#9467bd‘,
          ‘#8c564b‘,
          ‘#e377c2‘,
          ‘#7f7f7f‘,
          ‘#bcbd22‘,
          ‘#17becf‘,
          ‘#1a55FF‘]

# Configure rcParams axes.prop_cycle to simultaneously cycle cases and colors.
mpl.rcParams[‘axes.prop_cycle‘] = cycler(markevery=cases, color=colors)

# Create data points and offsets
x = np.linspace(0, 2 * np.pi)
offsets = np.linspace(0, 2 * np.pi, 11, endpoint=False)
yy = np.transpose([np.sin(x + phi) for phi in offsets])

# Set the plot curve with markers and a title
fig = plt.figure()
ax = fig.add_axes([0.1, 0.1, 0.6, 0.75])

for i in range(len(cases)):
    ax.plot(yy[:, i], marker=‘o‘, label=str(cases[i]))
    ax.legend(bbox_to_anchor=(1.05, 1), loc=‘upper left‘, borderaxespad=0.)

plt.title(‘Support for axes.prop_cycle cycler with markevery‘)

plt.show()

从这个例子中我们不难发现Python 第三方库的强大优势,总而言之python是优秀的脚本语言,适合于快速编写中小型程序代码,这就是我学习该门语言的主要目的。
标签:support pad figure tran none com 固定 数据可视化 data
原文地址:https://www.cnblogs.com/xv-student/p/10016441.html