标签:pen 技术分享 rri rgs spn ack latest 添加 bip
这里只说明在计算刻度和曲线绘制的时候 只提供思路,只是做了下简单的计算,不喜勿喷 还望见谅,高手直接飘过吧。这个要做好,还是需要研究研究算法的,比如刻度随着控件的大小发生改变的时候计算不同的值,根据刻度范围来计算刻度以及刻度值等,这里没有研究,制作简单的绘制,让其知道自定义曲线控件的画法,对于新手来讲应该是有一些帮助的。有时间我把研究过后的算法加上做一个通用可靠一点的控件分享。
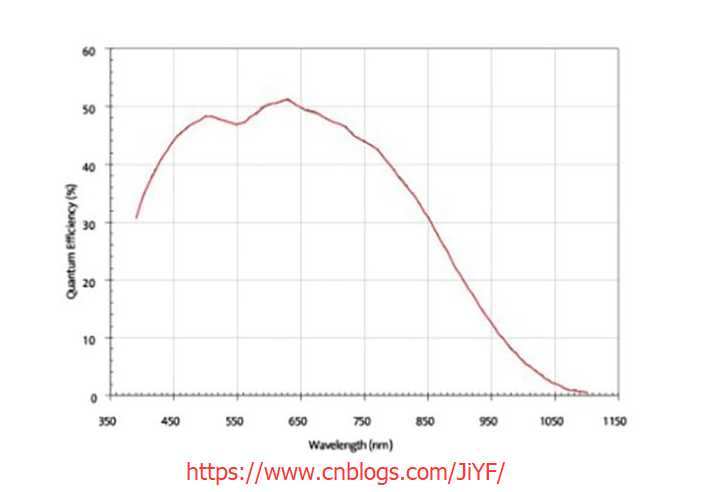
首先百度一张图片,就按照它的样子来绘制
在绘制曲线控件之前首先得 C#GDI+ 绘制线段(实线或虚线)、矩形、字符串、圆、椭圆
        protected override void OnPaint(PaintEventArgs e)
        {
            base.OnPaint(e);

            Graphics graphics = e.Graphics;
            //绘制代码部分。。。

        }

 1          #region 绘图区域
 2
 3           int plotBorder = 0;
 4           if (this.plotBorderWith % 2 == 0)
 5               plotBorder = this.plotBorderWith / 2;
 6           else
 7               plotBorder = this.plotBorderWith / 2 + 1;
 8
 9           int plotWidth = this.Width - this.Padding.Left - this.Padding.Right - this.plotBorderWith;
10           int plotHeitht = this.Height - this.Padding.Top - this.Padding.Bottom - this.plotBorderWith;
11
12
13           Rectangle plotArea = new Rectangle(
14               this.Padding.Left + plotBorder,
15               this.Padding.Top + plotBorder,
16               plotWidth,
17               plotHeitht);
18
19           using (SolidBrush brush = new SolidBrush(this.plotBackColor))
20           {
21               graphics.FillRectangle(brush, plotArea);
22           }
23
24           #endregion
 1              #region 绘制曲线区域
 2
 3              int borderwith = 0;
 4              if (this.gridBorderWith % 2 == 0)
 5                  borderwith = this.gridBorderWith / 2;
 6              else
 7                  borderwith = this.gridBorderWith / 2;
 8
 9              int gridWith = this.Width - this.Padding.Left - this.Padding.Right - this.FontHeight - this.FontHeight - this.gridBorderWith - 2 * this.plotBorderWith;
10              int gridHeight = this.Height - this.FontHeight - 2 * this.FontHeight - this.gridBorderWith;
11
12              Rectangle rectangle = new Rectangle(
13              this.Padding.Left + this.FontHeight + this.FontHeight + this.plotBorderWith + this.gridBorderWith / 2,
14              this.Padding.Top + this.FontHeight,
15              gridWith,
16              gridHeight);
17
18              using (SolidBrush solidGridBrush = new SolidBrush(this.gridBackColor))
19              {
20                  graphics.FillRectangle(solidGridBrush, rectangle);
21              }
22              using (Pen penGrid = new Pen(this.gridBorderColor, this.gridBorderWith))
23              {
24                  graphics.DrawRectangle(penGrid, rectangle);
25              }
26              #endregion
 1             #region 绘制文本区域
 2
 3             SizeF szfTitle;
 4             SizeF szfyLabel;
 5             SizeF szfxLabel;
 6
 7             szfTitle = graphics.MeasureString(this.title, this.Font);
 8             szfyLabel = graphics.MeasureString(this.yLabel, this.Font);
 9             szfxLabel = graphics.MeasureString(this.xLabel, this.Font);
10
11             //绘制标题
12             if (this.title != null)
13             {
14                 int strLeft = rectangle.X + rectangle.Width / 2 - (int)szfTitle.Width / 2;
15                 int strHeight = this.Padding.Top + this.plotBorderWith;
16
17                 graphics.DrawString(this.title, this.Font, Brushes.Black, strLeft, strHeight);
18             }
19             //绘制垂直方向文本
20             if (this.yLabel != null)
21             {
22                 graphics.TranslateTransform(0, this.Height);   //坐标平移
23                 graphics.RotateTransform(-90);                 //坐标旋转
24
25                 int strLeft = 0;
26                 if (this.xLabel != "")
27                     strLeft = this.Padding.Bottom + this.gridBorderWith + 2 * (int)szfxLabel.Height + rectangle.Height / 2 - (int)szfyLabel.Width / 2;
28                 else
29                     strLeft = this.Padding.Bottom + this.gridBorderWith + (int)szfxLabel.Height + rectangle.Height / 2 - (int)szfyLabel.Width / 2;
30
31                 int strHeight = 0;
32
33                 graphics.DrawString(this.yLabel, this.Font, Brushes.Black, strLeft, strHeight);
34
35                 graphics.RotateTransform(90);
36                 graphics.TranslateTransform(0, -this.Height);
37
38             }
39             //绘制水平方向文本
40             if (this.xLabel != null)
41             {
42                 int strLeft = rectangle.X + rectangle.Width / 2 - (int)szfxLabel.Width / 2;
43                 int strHeight = rectangle.Y + rectangle.Height + (int)szfxLabel.Height;
44
45                 graphics.DrawString(this.xLabel, this.Font, Brushes.Black, strLeft, strHeight);
46             }
47             #endregion
这里提供思路,没有仔细去计算,
 1             #region x轴
 2
 3             double scale = (this.xMax - this.xMin) / rectangle.Width;
 4
 5             int number = 10;                                //将x轴分为10份实际根据控件的大小来做分配,这里简单举例10份为例
 6             double perPixel = rectangle.Width / number;     //每一份的占用的像素宽度
 7             double value = 100;                             //间隔值   这里只是写测试例子直接写死了,按照使用来讲不能这么干有时间了,这是个算法问题,重新补上
 8
 9             int position = 0;
10             double positionValue = this.xMin;
11             using (Pen pen = new Pen(this.gridLineColor, 1))
12             {
13                 for (int i = 0; i < number; i++)
14                 {
15                     pen.DashStyle = DashStyle.Solid;
16
17                     //x轴刻度
18
19                     graphics.DrawLine(pen,
20                           rectangle.X + position,
21                           rectangle.Y + rectangle.Height,
22                           rectangle.X + position,
23                           rectangle.Y + rectangle.Height - 8);
24
25
26                     string scaleValue = positionValue.ToString("F0");
27                     SizeF szfValue = graphics.MeasureString(scaleValue, this.Font);
28
29                     int strX = rectangle.X + position - (int)szfValue.Width / 2;
30                     int strY = rectangle.Y + rectangle.Height;
31
32                     //x轴刻度值
33                     graphics.DrawString(scaleValue, this.Font, Brushes.Black, strX, strY);
34
35                     positionValue += value;
36                     position += (int)perPixel;
37                 }
38
39             }
40
41             #endregion
42
43             #region y轴
44             double scaley = (this.yMax - this.yMin) / this.Width;
45
46             int numbery = 6;
47             double perPixelY = rectangle.Height / numbery;
48             double valueYinterval = 10;
49
50             int positiony = 0;
51             double positionValueY = this.yMin;
52             using (Pen pen = new Pen(this.gridLineColor, 1))
53             {
54                 for (int i = 0; i <= numbery; i++)
55                 {
56
57                     pen.DashStyle = DashStyle.Solid;
58
59                     //y轴刻度
60
61                     graphics.DrawLine(pen,
62                           rectangle.X,
63                           rectangle.Y + rectangle.Height - positiony,
64                           rectangle.X + 8,
65                           rectangle.Y + rectangle.Height - positiony);
66
67
68                     string scaleValueY = positionValueY.ToString("F0");
69                     SizeF szfValue = graphics.MeasureString(scaleValueY, this.Font);
70
71                     int strX = rectangle.X - (int)szfValue.Width;
72                     int strY = rectangle.Y + rectangle.Height - positiony - (int)szfValue.Height/2;
73
74                     //x轴刻度值
75                     graphics.DrawString(scaleValueY, this.Font, Brushes.Black, strX, strY);
76                     positionValueY += valueYinterval;
77                     positiony += (int)perPixelY;
78                 }
79
80             }
81             #endregion
这里绘制曲线只提供思路,没有仔细研究算法
 1             #region 绘制曲线
 2
 3             if (x == null || y == null) return;
 4
 5             float scaleX = (float)(rectangle.Width / (this.xMax - this.xMin));
 6             float scaleY = (float)(rectangle.Height / (this.yMax - this.yMin));
 7
 8             PointF[] points = new PointF[x.Length];
 9
10             for (int i = 0; i < this.x.Length; i++)
11             {
12                 points[i] = new PointF(
13                           (float)((this.x[i] - this.xMin) * scaleX + rectangle.X),
14                            rectangle.Y + rectangle.Height - (float)((this.y[i] - this.yMin) * scaleY));
15             }
16
17             using (Pen pen = new Pen(this.curveColor))
18             {
19                 graphics.DrawLines(pen, points);
20             }
21
22             #endregion
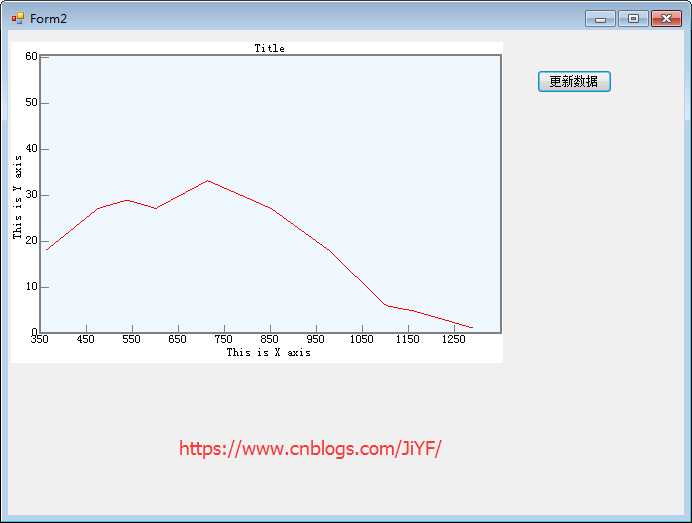
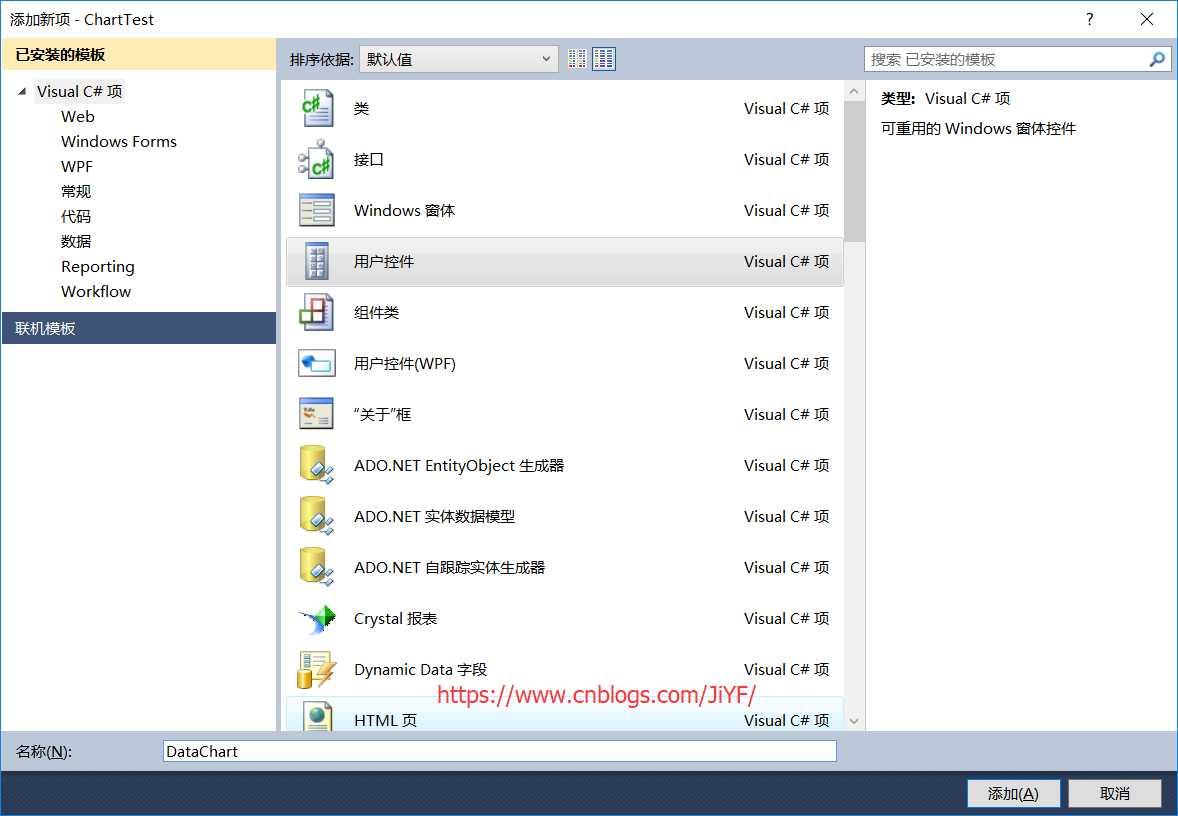
C#GDI+自定义绘制曲线图表控件DataChart 简单实现
标签:pen 技术分享 rri rgs spn ack latest 添加 bip
原文地址:https://www.cnblogs.com/JiYF/p/10042536.html
