标签:求导 mat pen ati 机器 获得 shape plt 条件
梯度下降: 对theta1, theta2, theta3 分别求最快梯度下降的方向,然后根据给定的学习率,进行theta1, theta2, theta3的参数跟新
假定目标函数 J(theta) = 1/2m * np.sum(h(theta) - y)^2 / len(X)
梯度下降的策略分为3种,
批量梯度下降: 每次迭代输入全部的数据, 效果好,但耗时
随机梯度下降: 每次输入一个样本,时间快,迭代效果差
小批量梯度下降:每次输入部分数据,效果好,时间适中,一般都是16, 32, 64
逻辑回归: 是一种典型的二分类,也可以是多分类,主要在于cost的定义
逻辑回归的概率似然函数: h(theta)**y * (1-h(theta)) ** (1-y)
逻辑回归的对数似然函数 l(theta) = 1/ m * np.sum(y*logh(theta) - (1-y)*log(1-h(theta))) # 及损失函数
依据theta对损失函数进行求导,求出梯度下降的方向,用于跟新参数
grad = 1/m np.sum(h(theta) - y) * xj xj表示的是一列特征
theta = theta - grad
接下来进行代码分析
需要完成的函数
主要函数
sigmoid #将数值映射为概率
model # 构造h(theta) 即 sigmoid(np.dot(X, theta.T))
cost # 计算损失值及对数似然函数 1/ m * np.sum(-y*logh(theta) - (1-y)*log(1-h(theta)))
gradient # 用于计算梯度 grad = 1/m np.sum(h(theta) - y) * xj
descent # 用于进行参数更新
runExpe # 进行画图操作
predict # 进行结果预测
次要函数
shuffledata # 用于进行数据清洗
StopCriter # 停止情况判断
代码:
import numpy as np
import pandas as pd
import time
import matplotlib.pyplot as plt

pdData = pd.read_csv(‘data/LogiReg_data.txt‘, header=None, names=[‘exam1‘, ‘exam2‘, ‘admitted‘])

# 插入一列全1的数据, 为了和theta0进行匹配
pdData.insert(0, ‘ones‘, 1)
# 将数据转换的为numpy形式
orig_data = pdData.as_matrix()
# 获得列的维度
cols = orig_data.shape[1]
# 分出样本
X = orig_data[:, :cols-1]
# 分出标签
y = orig_data[:, cols-1:]
# 初始化theta
theta = np.zeros([1, 3])
# 定义sigmoid函数
def sigmoid(z):
    return (1 / (1 + np.exp(-z)))
# 定义H(theta)
def model(X, theta):
    return sigmoid(np.dot(X, theta.T))

# 定义损失函数即对数似然函数   1/ m * np.sum(-y*logh(theta) - (1-y)*log(1-h(theta)))
def cost(X, y, theta):
    left = np.multiply(-y, np.log(model(X, theta)))
    right = np.multiply((1-y), np.log(1-model(X, theta)))
    return np.sum(left - right) / len(X)
# 定义数据洗牌的函数
def shuffle_data(data):
    # 进行数据洗牌
    np.random.shuffle(data)
    # 分离出X和y
    cols = data.shape[1]
    X = data[:, :cols-1]
    y = data[:, cols-1:]
    return X, y

# 定义停止条件的函数
Stop_iter = 0
Stop_cost = 1
Stop_grad = 2
def StopCriter(Stop_name, value, threshold):
    # 如果迭代条件是迭代次数,返回迭代比较的结果,真或者假
    if Stop_name == Stop_iter: return value > threshold
    # 如果迭代条件是损失值,返回最后两个损失值之差,如果低于阈值,返回为真
    elif Stop_name == Stop_cost: return value[-2] - value[-1] < threshold
    # 如果迭代条件是梯度下降的方向向量,返回的是梯度下降方向向量的模,如果低于阈值,则返回为真
    elif Stop_name == Stop_grad: return np.linalg.norm(value) < threshold

# 用于计算梯度下降方向的向量 grad = 1/m np.sum(h(theta) - y) * xj
def gradient(X, y, theta):
    # 初始化梯度值
    grad = np.zeros_like(theta)
    # 计算误差 ravel()函数将(100, 1)转换为(100, )
    error = (model(X, theta) - y).ravel()
    # 计算每一个方向上的梯度方向
    for j in range(X.shape[1]):
        term = np.multiply(error, X[:, j])
        grad[0, j] = np.sum(term) / len(X)
    return grad
# 在梯度方向上进行theta的参数更新
def descent(data, theta, batchsize, Stop_name, threshold, alpha):
    # 数据进行洗牌
    X, y = shuffle_data(data)
    k = 0
    # 获得损失值函数
    costs = [cost(X, y, theta)]
    # 迭代次数
    i = 0
    # 初始时间
    init_time = time.time()
    # 循环
    while True:
        # 获得batchsize的样本
        batch_x, batch_y = X[k:k+batchsize], y[k:k+batchsize]
        # 更新k
        k = k + batchsize
        # 如果k大于样本数,置0,重新获得洗牌后的X和y
        if k >= X.shape[0]:
            k = 0
            X, y = shuffle_data(data)
        # 计算梯度方向
        grad = gradient(batch_x, batch_y, theta)
        # 更新参数
        theta = theta - alpha * grad
        # 重新计算损失值
        costs.append(cost(X, y, theta))
        i = i + 1
        # 根据迭代的条件获得当前的value值
        if Stop_name == Stop_iter:value = i
        elif Stop_name == Stop_cost: value=costs
        elif Stop_name == Stop_grad: value=grad
        # 将value值输入,与阈值进行条件比较,满足即跳出循环
        if StopCriter(Stop_name, value, threshold):
            break
    # 返回
    return   data, theta, i, batchsize, Stop_name, threshold, alpha, time.time() - init_time, costs
# 进行画图操作
def runExpe(data, theta, batchsize, Stop_name, threshold, alpha):
    data, theta, i, batchsize, Stop_name, threshold, alpha, dur, costs = descent(data, theta, batchsize, Stop_name, threshold, alpha)
    name = "Original" if (data[:, 1] > 2).sum() > 1 else "Scaled"
    name += " data - learning rate: {} - ".format(alpha)
    if batchsize == n:
        strDescType = "Gradient"
    elif batchsize == 1:
        strDescType = "Stochastic"
    else:
        strDescType = "Mini-batch ({})".format(batchsize)
    name += strDescType + " descent - Stop: "
    if Stop_name == Stop_iter:
        strStop = "{} iterations".format(threshold)
    elif Stop_name == Stop_cost:
        strStop = "costs change < {}".format(threshold)
    else:
        strStop = "gradient norm < {}".format(threshold)
    name += strStop
    print("***{}\nTheta: {} - Iter: {} - Last cost: {:03.2f} - Duration: {:03.2f}s".format(
        name, theta, iter, costs[-1], dur))
    fig, ax = plt.subplots(figsize=(12, 4))
    ax.plot(np.arange(len(costs)), costs, ‘r‘)
    ax.set_xlabel(‘Iterations‘)
    ax.set_ylabel(‘Cost‘)
    ax.set_title(name.upper() + ‘ - Error vs. Iteration‘)

    return theta

# 预测函数
def predict(X, theta):
    # 代入h(theta) 即model中进行样本预测
    pre_y = model(X, theta)
    # 概率大于0.5的,输出为1, 小于0.5的输出为0
    pre_y[pre_y >= 0.5] = 1
    pre_y[pre_y < 0.5] = 0
    # 返回预测结果的向量
    return pre_y
# 表示样本的总个数
n = 100
# 获得迭代好以后的theta
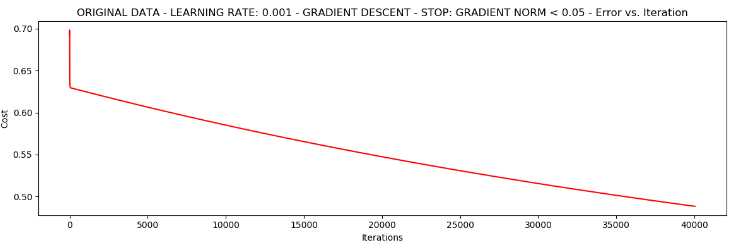
theta = runExpe(orig_data, theta, 100, Stop_grad, 0.05, alpha=0.001)
# 进行数据归一化操作
import sklearn.preprocessing as pp
scale_data = orig_data.copy()
# 对第二列和第三列数据进行归一化操作
scale_data[:, 1:3] = pp.scale(scale_data[:, 1:3])
# 获得预测结果的向量
pre_y = predict(X, theta)
# 将预测结果与真实结果进行比较,返回0和1的数组,正确是1,错误是0
correct_array = np.array(pre_y == y, dtype=int)
# 准确率就是计算正确和错误的平均值
accurracy = correct_array.mean()
print(accurracy)

迭代次数与损失值cost的作图
标签:求导 mat pen ati 机器 获得 shape plt 条件
原文地址:https://www.cnblogs.com/my-love-is-python/p/10260545.html