标签:结构 性能 测试 global sts 更新 pool alt cached
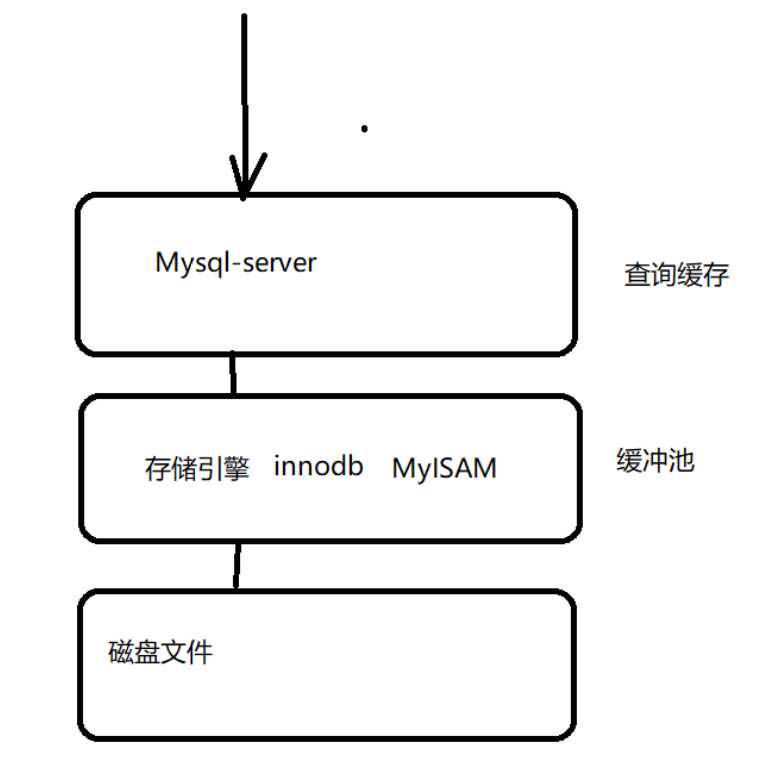
mysql结构简介
1,慢查询
查看某个变量的值,一般是看配置:show variables like ‘%slow%‘;
查看当前某个参数的状态值,一般是动态的,而且是在命令行下查看:show global status like ‘%long_query%‘;

使用配置查看:具体配置在上上篇里面讲了,使用命令:mysqldumpslow -s at 10 slow.log
2,连接数
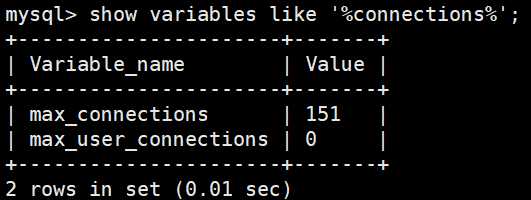
查看当前mysql里面配置的连接数:show variables like ‘%connections%‘;
max_connections:整个MySql允许的最大连接数
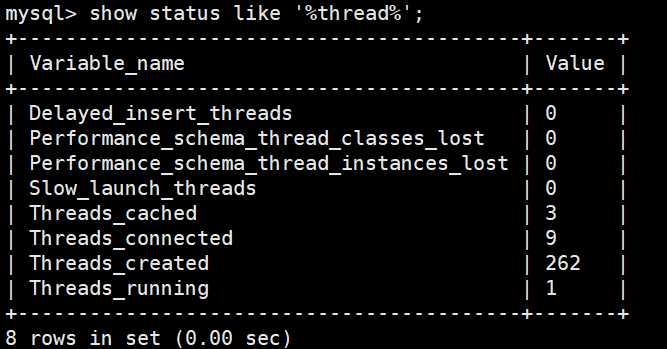
查看当前连接数:show status like ‘%thread%‘;
其中:
Threads_connected 当前打开的连接的数量
Threads_cached 线程缓存内的线程的数量
Threads_created 创建的线程数
Threads_running 激活的(非睡眠状态)线程数
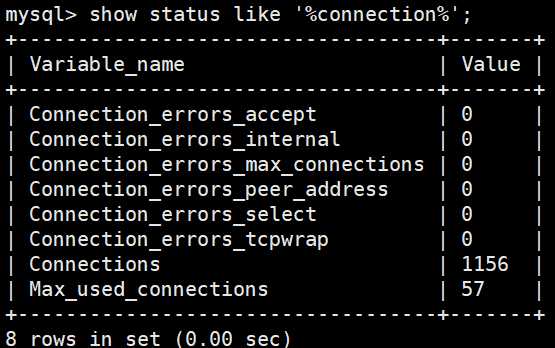
show status like ‘%connection%‘;
Connections 试图连接MySQL服务器的次数
3,缓冲池(作用类似于Redis,缓存的是数据)
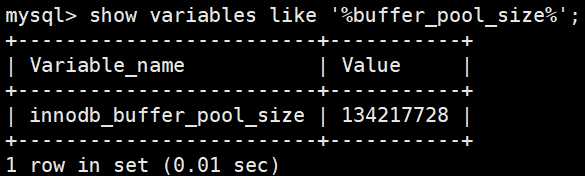
查看缓冲池的大小(在不影响其他的情况下能配多大配多大):show variables like ‘%buffer_pool_size%‘;
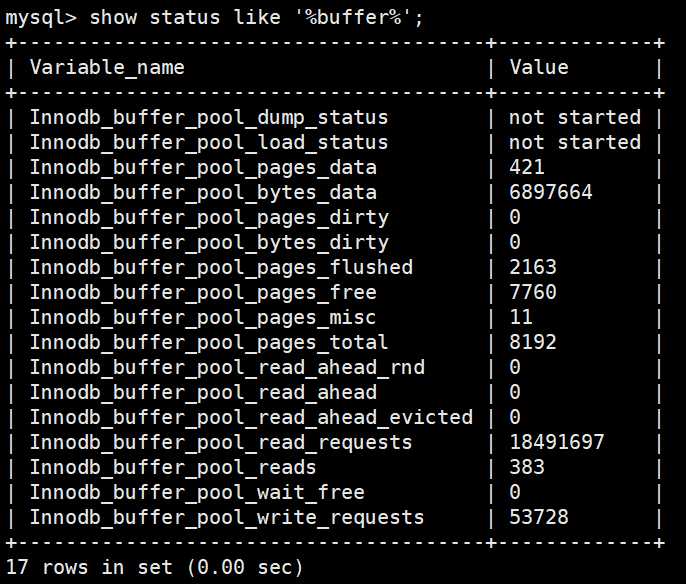
查看当前缓冲池里面的状态值:show status like ‘%buffer%‘;
其中:
Innodb_buffer_pool_reads:缓冲池中没有读到数据,而从磁盘内读取的次数
Innodb_buffer_pool_read_requests:来缓冲池中读数据的次数
Innodb_buffer_pool_pages_total:缓冲池的总页数(内存是以页为单位)
Innodb_buffer_pool_pages_free:缓冲池中处于空闲状态的页数
命中率:innodb_buffer_read_hits=(1-Innodb_buffer_pool_reads/Innodb_buffer_pool_read_requests)*100%
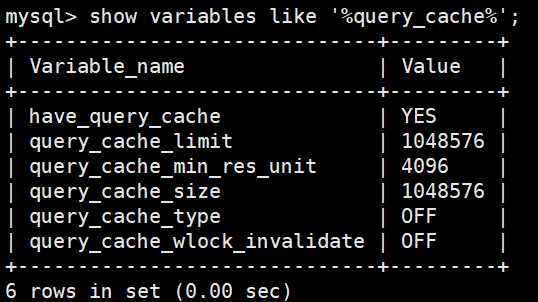
4,查询缓存 (缓存的是sql语句)
show variables like ‘%query_cache%‘;
show status like ‘%Qcache%‘;
命中率:Query_cache_hits=(Qcache_hits/(Qcache_hits+Qcache_inserts))*100%
5,线程缓存(连接池)
show variables like ‘%thread%‘;
show status like ‘connections‘;
show status like ‘%thread%‘;
Threads_Cache_Hit=(Connections-Threads_created)/Connections*100%
6,表锁和行锁 (若没有锁,如果有人在更新数据,此时有人又在查询数据,这个时候查出来的数据不正确)
show status like ‘%lock%‘;
存储引擎:早期mysql用的,MyISAM,现在都用Innodb
MyISAM:支持表锁
Innodb:支持行锁、支持事务
详见《高性能mysql》
标签:结构 性能 测试 global sts 更新 pool alt cached
原文地址:https://www.cnblogs.com/zhongyehai/p/10332325.html