标签:style blog http color ar 使用 sp 数据 div
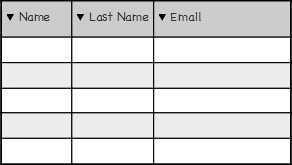
表格例子
样本如下:

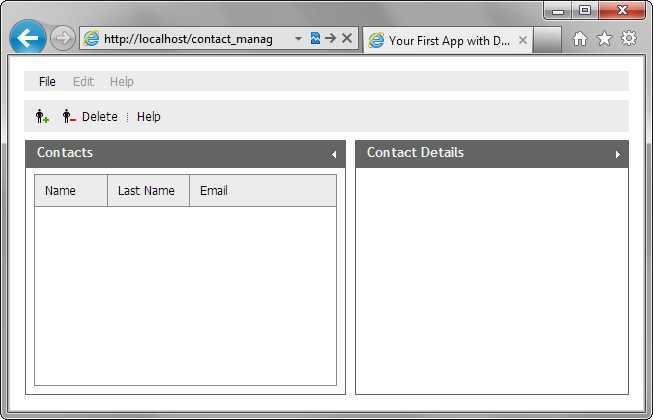
我们这篇介绍的是dhtmlxGrid 组件。 它支持4种数据格式:XML, JSON, CSV, JSArray.
1.使用attachGrid() 方法将表格添加到布局的单元格中去。
 var layout = new dhtmlXLayoutObject(document.body,"2U");
 var contactsGrid = layout.cells("a").attachGrid();
2.继续添加代码 进行gird的初始化设置:
contactsGrid.setHeader("Name,Last Name,Email");   //sets the headers of columns
contactsGrid.setColumnIds("fname,lname,email");         //sets the columns‘ ids
contactsGrid.setInitWidths("250,250,*");   //sets the initial widths of columns
contactsGrid.setColAlign("left,left,left");     //sets the alignment of columns
contactsGrid.setColTypes("ro,ro,ro");               //sets the types of columns
contactsGrid.setColSorting("str,str,str");  //sets the sorting types of columns
3.用init() 方法进行表格的初始化
contactsGrid.init();

DHTMLX 前端框架 建立你的一个应用程序 教程(五)--添加一个表格Grid
标签:style blog http color ar 使用 sp 数据 div
原文地址:http://www.cnblogs.com/DemoLee/p/4032272.html