标签:legend imp port tick col alt sim sans color
import matplotlib.pyplot as plt
import matplotlib as mpl

mpl.rcParams["font.sans-serif"] = ["SimHei"]
mpl.rcParams["axes.unicode_minus"] = False

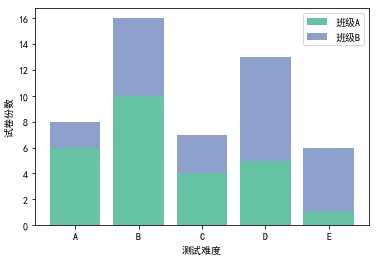
x = [1, 2, 3, 4, 5]
y = [6, 10, 4, 5, 1]
y1 = [2, 6, 3, 8, 5]

plt.bar(x, y, align="center", color="#66c2a5", tick_label=["A", "B", "C", "D", "E"], label="班级A")
plt.bar(x, y1, align="center", bottom=y, color="#8da0cb", label="班级B")

plt.xlabel("测试难度")
plt.ylabel("试卷份数")

plt.legend()

plt.show()

标签:legend imp port tick col alt sim sans color
原文地址:https://www.cnblogs.com/czz0508/p/10457366.html