标签:val lower sem sub classes play lap main noi
这个小段的内容主要是朴素贝叶斯、支持向量机、决策树和集成学习的代码,看不懂..........后面的更是看不懂..................
朴素贝叶斯:
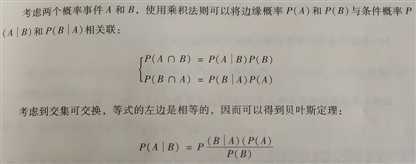

scikit-learn提供了伯努利,多项式,高斯三个变体。伯努利是一个二项分布,多项式是离散分布,高斯是连续分布。用在不同的场景里:
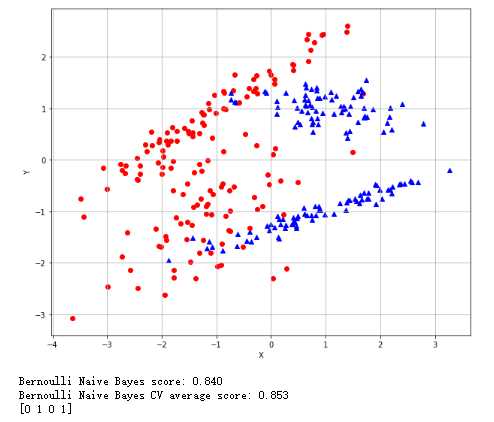
伯努利朴素贝叶斯:验证测试点的分布:

 1 from __future__ import print_function
 2 import numpy as np
 3 import matplotlib.pyplot as plt
 4 from sklearn.datasets import make_classification
 5 from sklearn.model_selection import train_test_split, cross_val_score
 6 from sklearn.naive_bayes import BernoulliNB
 7 # For reproducibility
 8 np.random.seed(1000)
 9 nb_samples = 300
10 def show_dataset(X, Y):
11     fig, ax = plt.subplots(1, 1, figsize=(10, 8))
12     ax.grid()
13     ax.set_xlabel(‘X‘)
14     ax.set_ylabel(‘Y‘)
15     for i in range(nb_samples):
16         if Y[i] == 0:
17             ax.scatter(X[i, 0], X[i, 1], marker=‘o‘, color=‘r‘)
18         else:
19             ax.scatter(X[i, 0], X[i, 1], marker=‘^‘, color=‘b‘)
20     plt.show()
21
22 if __name__ == ‘__main__‘:
23     # Create dataset
24     X, Y = make_classification(n_samples=nb_samples, n_features=2, n_informative=2, n_redundant=0)
25     # Show dataset
26     show_dataset(X, Y)
27     # Split dataset
28     X_train, X_test, Y_train, Y_test = train_test_split(X, Y, test_size=0.25)
29     # Create and train Bernoulli Naive Bayes classifier
30     bnb = BernoulliNB(binarize=0.0)
31     bnb.fit(X_train, Y_train)
32     print(‘Bernoulli Naive Bayes score: %.3f‘ % bnb.score(X_test, Y_test))
33     # Compute CV score
34     bnb_scores = cross_val_score(bnb, X, Y, scoring=‘accuracy‘, cv=10)
35     print(‘Bernoulli Naive Bayes CV average score: %.3f‘ % bnb_scores.mean())
36     # Predict some values
37     data = np.array([[0, 0], [1, 0], [0, 1], [1, 1]])
38     Yp = bnb.predict(data)
39     print(Yp)
多项式朴素贝叶斯:根据数据预测城市还是农村:

 1 from __future__ import print_function
 2 import numpy as np
 3 from sklearn.feature_extraction import DictVectorizer
 4 from sklearn.naive_bayes import MultinomialNB
 5 # For reproducibility
 6 np.random.seed(1000)
 7 if __name__ == ‘__main__‘:
 8     # Prepare a dummy dataset
 9     data = [
10         {‘house‘: 100, ‘street‘: 50, ‘shop‘: 25, ‘car‘: 100, ‘tree‘: 20},
11         {‘house‘: 5, ‘street‘: 5, ‘shop‘: 0, ‘car‘: 10, ‘tree‘: 500, ‘river‘: 1}
12     ]
13     # Create and train a dictionary vectorizer
14     dv = DictVectorizer(sparse=False)
15     X = dv.fit_transform(data)
16     Y = np.array([1, 0])
17     print(X)
18     # Create and train a Multinomial Naive Bayes classifier
19     mnb = MultinomialNB()
20     mnb.fit(X, Y)
21
22     # Create dummy test data
23     test_data = data = [
24         {‘house‘: 80, ‘street‘: 20, ‘shop‘: 15, ‘car‘: 50, ‘tree‘: 20, ‘river‘: 1},
25         {‘house‘: 10, ‘street‘: 5, ‘shop‘: 1, ‘car‘: 8, ‘tree‘: 300, ‘river‘: 0}
26     ]
27     #测试城市还是农村
28     Yp = mnb.predict(dv.fit_transform(test_data))
29     print(Yp)

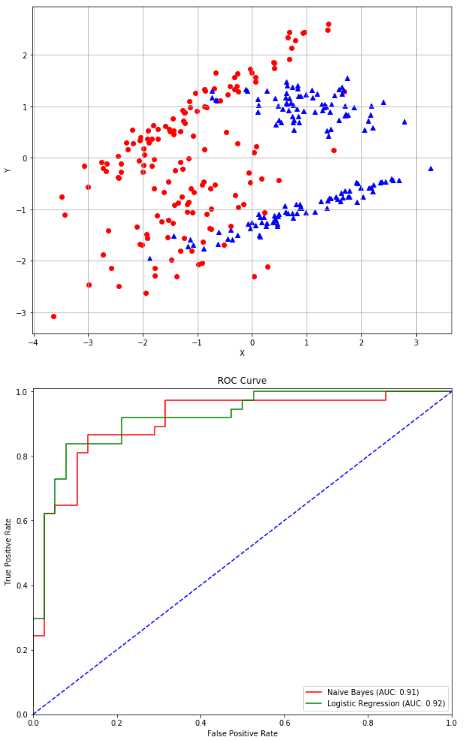
高斯朴素贝叶斯:验证点并通过ROC曲线比较结果

 1 from __future__ import print_function
 2 import numpy as np
 3 import matplotlib.pyplot as plt
 4 from sklearn.datasets import make_classification
 5 from sklearn.naive_bayes import GaussianNB
 6 from sklearn.model_selection import train_test_split
 7 from sklearn.linear_model import LogisticRegression
 8 from sklearn.metrics import roc_curve, auc
 9 # For reproducibility
10 np.random.seed(1000)
11 nb_samples = 300
12 def show_dataset(X, Y):
13     fig, ax = plt.subplots(1, 1, figsize=(10, 8))
14
15     ax.grid()
16     ax.set_xlabel(‘X‘)
17     ax.set_ylabel(‘Y‘)
18
19     for i in range(nb_samples):
20         if Y[i] == 0:
21             ax.scatter(X[i, 0], X[i, 1], marker=‘o‘, color=‘r‘)
22         else:
23             ax.scatter(X[i, 0], X[i, 1], marker=‘^‘, color=‘b‘)
24
25     plt.show()
26
27
28 if __name__ == ‘__main__‘:
29     # Create dataset
30     X, Y = make_classification(n_samples=nb_samples, n_features=2, n_informative=2, n_redundant=0)
31
32     # Show dataset
33     show_dataset(X, Y)
34
35     # Split dataset
36     X_train, X_test, Y_train, Y_test = train_test_split(X, Y, test_size=0.25)
37
38     # Create and train Gaussian Naive Bayes classifier
39     gnb = GaussianNB()
40     gnb.fit(X_train, Y_train)
41
42     # Create and train a Logistic regressor (for comparison)
43     lr = LogisticRegression()
44     lr.fit(X_train, Y_train)
45
46     # Compute ROC Curve
47     Y_gnb_score = gnb.predict_proba(X_test)
48     Y_lr_score = lr.decision_function(X_test)
49
50     fpr_gnb, tpr_gnb, thresholds_gnb = roc_curve(Y_test, Y_gnb_score[:, 1])
51     fpr_lr, tpr_lr, thresholds_lr = roc_curve(Y_test, Y_lr_score)
52
53     # Plot ROC Curve
54     plt.figure(figsize=(10, 8))
55
56     plt.plot(fpr_gnb, tpr_gnb, color=‘red‘, label=‘Naive Bayes (AUC: %.2f)‘ % auc(fpr_gnb, tpr_gnb))
57     plt.plot(fpr_lr, tpr_lr, color=‘green‘, label=‘Logistic Regression (AUC: %.2f)‘ % auc(fpr_lr, tpr_lr))
58     plt.plot([0, 1], [0, 1], color=‘blue‘, linestyle=‘--‘)
59     plt.xlim([0.0, 1.0])
60     plt.ylim([0.0, 1.01])
61     plt.title(‘ROC Curve‘)
62     plt.xlabel(‘False Positive Rate‘)
63     plt.ylabel(‘True Positive Rate‘)
64     plt.legend(loc="lower right")
65
66     plt.show()
对比高斯朴素贝叶斯和多项式朴素贝叶斯在MNIST上的性能:
1 from sklearn.datasets import load_digits
2 from sklearn.model_selection import cross_val_score
3 digits = load_digits()
4 gnb = GaussianNB()
5 mnb = MultinomialNB()
6 print(cross_val_score(gnb, digits.data, digits.target, scoring = ‘accuracy‘, cv = 10).mean())
7 print(cross_val_score(mnb, digits.data, digits.target, scoring = ‘accuracy‘, cv = 10).mean())

支持向量机:
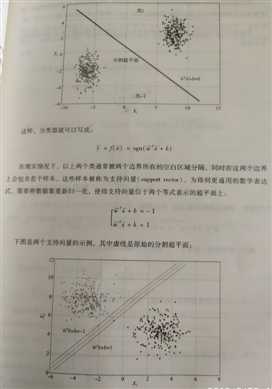
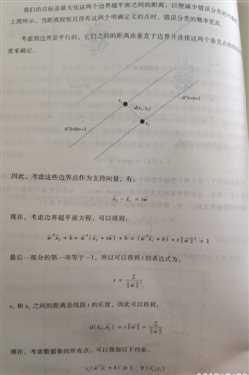

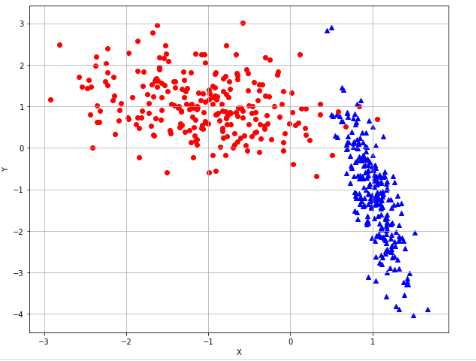
线性分类:

 1 from __future__ import print_function
 2 import numpy as np
 3 import matplotlib.pyplot as plt
 4 from sklearn.datasets import make_classification
 5 from sklearn.svm import SVC
 6 from sklearn.model_selection import cross_val_score
 7 # For reproducibility
 8 np.random.seed(1000)
 9 nb_samples = 500
10 def show_dataset(X, Y):
11     fig, ax = plt.subplots(1, 1, figsize=(10, 8))
12     ax.grid()
13     ax.set_xlabel(‘X‘)
14     ax.set_ylabel(‘Y‘)
15     for i in range(nb_samples):
16         if Y[i] == 0:
17             ax.scatter(X[i, 0], X[i, 1], marker=‘o‘, color=‘r‘)
18         else:
19             ax.scatter(X[i, 0], X[i, 1], marker=‘^‘, color=‘b‘)
20     plt.show()
21
22 if __name__ == ‘__main__‘:
23     # Create dataset
24     X, Y = make_classification(n_samples=nb_samples, n_features=2, n_informative=2, n_redundant=0,
25                                n_clusters_per_class=1)
26     # Show dataset
27     show_dataset(X, Y)
28     # Create a SVM with linear kernel
29     svc = SVC(kernel=‘linear‘)
30     # Compute CV score
31     svc_scores = cross_val_score(svc, X, Y, scoring=‘accuracy‘, cv=10)
32     print(‘Linear SVM CV average score: %.3f‘ % svc_scores.mean())
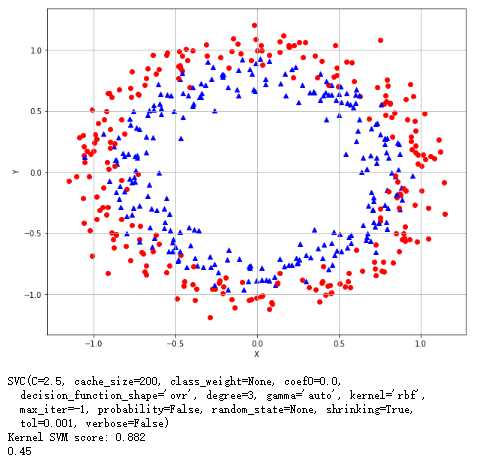
基于内核的分类:径向基核(Radial Basis Function),多项式核(Ploymomial kernel),sigmoid核,自定义核:
非线性例子:找到最好的内核并得到测试结果

 1 from __future__ import print_function
 2 import numpy as np
 3 import matplotlib.pyplot as plt
 4 import multiprocessing
 5 from sklearn.datasets import make_circles
 6 from sklearn.model_selection import GridSearchCV
 7 from sklearn.svm import SVC
 8 # For reproducibility
 9 np.random.seed(1000)
10 nb_samples = 500
11
12 def show_dataset(X, Y):
13     fig, ax = plt.subplots(1, 1, figsize=(10, 8))
14     ax.grid()
15     ax.set_xlabel(‘X‘)
16     ax.set_ylabel(‘Y‘)
17     for i in range(nb_samples):
18         if Y[i] == 0:
19             ax.scatter(X[i, 0], X[i, 1], marker=‘o‘, color=‘r‘)
20         else:
21             ax.scatter(X[i, 0], X[i, 1], marker=‘^‘, color=‘b‘)
22     plt.show()
23
24 if __name__ == ‘__main__‘:
25     # Create datasets
26     X, Y = make_circles(n_samples=nb_samples, noise=0.1)
27     # Show dataset
28     show_dataset(X, Y)
29     # Define a param grid
30     param_grid = [
31         {
32             ‘kernel‘: [‘linear‘, ‘rbf‘, ‘poly‘, ‘sigmoid‘],
33             ‘C‘: [0.1, 0.2, 0.4, 0.5, 1.0, 1.5, 1.8, 2.0, 2.5, 3.0]
34         }
35     ]
36     # Create a train grid search on SVM classifier
37     gs = GridSearchCV(estimator=SVC(), param_grid=param_grid,
38                       scoring=‘accuracy‘, cv=10, n_jobs=multiprocessing.cpu_count())
39     gs.fit(X, Y)
40     print(gs.best_estimator_)
41     print(‘Kernel SVM score: %.3f‘ % gs.best_score_)
42
43     #线性回归的分类效果
44     lr = LogisticRegression()
45     print(cross_val_score(lr,X,Y,scoring=‘accuracy‘,cv=10).mean())
对MNIST使用支持向量机找到最好的内核:

 1 from __future__ import print_function
 2 import numpy as np
 3 import multiprocessing
 4 from sklearn.datasets import load_digits
 5 from sklearn.model_selection import GridSearchCV
 6 from sklearn.svm import SVC
 7 # For reproducibility
 8 np.random.seed(1000)
 9 if __name__ == ‘__main__‘:
10     # Load dataset
11     digits = load_digits()
12     # Define a param grid
13     param_grid = [
14         {
15             ‘kernel‘: [‘linear‘, ‘rbf‘, ‘poly‘, ‘sigmoid‘],
16             ‘C‘: [0.1, 0.2, 0.4, 0.5, 1.0, 1.5, 1.8, 2.0, 2.5, 3.0]
17         }
18     ]
19     # Create a train grid search on SVM classifier
20     gs = GridSearchCV(estimator=SVC(), param_grid=param_grid,
21                       scoring=‘accuracy‘, cv=10, n_jobs=multiprocessing.cpu_count())
22     print(gs.fit(digits.data, digits.target))
23     print(gs.best_estimator_)#最好的内核
24     print(‘Kernel SVM score: %.3f‘ % gs.best_score_)

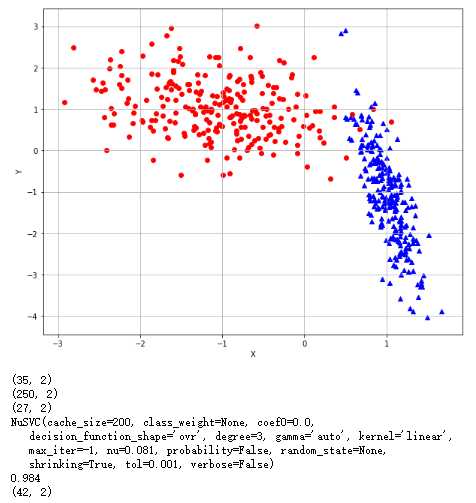
受控支持向量机:并通过网格寻找最佳选择

 1 from __future__ import print_function
 2 import numpy as np
 3 import matplotlib.pyplot as plt
 4 from sklearn.datasets import make_classification
 5 from sklearn.svm import SVC, NuSVC
 6 from sklearn.model_selection import GridSearchCV
 7 import multiprocessing
 8 # For reproducibility
 9 np.random.seed(1000)
10 nb_samples = 500
11 def show_dataset(X, Y):
12     fig, ax = plt.subplots(1, 1, figsize=(10, 8))
13     ax.grid()
14     ax.set_xlabel(‘X‘)
15     ax.set_ylabel(‘Y‘)
16     for i in range(nb_samples):
17         if Y[i] == 0:
18             ax.scatter(X[i, 0], X[i, 1], marker=‘o‘, color=‘r‘)
19         else:
20             ax.scatter(X[i, 0], X[i, 1], marker=‘^‘, color=‘b‘)
21     plt.show()
22
23 if __name__ == ‘__main__‘:
24     # Create dataset
25     X, Y = make_classification(n_samples=nb_samples, n_features=2, n_informative=2, n_redundant=0,
26                                n_clusters_per_class=1)
27     # Show dataset
28     show_dataset(X, Y)
29     # Create and train a linear SVM
30     svc = SVC(kernel=‘linear‘)
31     svc.fit(X, Y)
32     print(svc.support_vectors_.shape)
33     # Create and train a Nu-SVM classifier
34     nusvc = NuSVC(kernel=‘linear‘, nu=0.5)
35     nusvc.fit(X, Y)
36     print(nusvc.support_vectors_.shape)
37     nusvc = NuSVC(kernel=‘linear‘, nu=0.05)
38     nusvc.fit(X, Y)
39     print(nusvc.support_vectors_.shape)
40
41     param_grid = [
42         {
43             ‘nu‘ : np.arange(0.081,1.0,0.5)
44         }
45     ]
46     gs = GridSearchCV(estimator=NuSVC(kernel=‘linear‘),param_grid = param_grid , scoring=‘accuracy‘,cv=10,n_jobs=multiprocessing.cpu_count())
47     gs.fit(X,Y)
48     print(gs.best_estimator_)
49     print(gs.best_score_)
50     print(gs.best_estimator_.support_vectors_.shape)
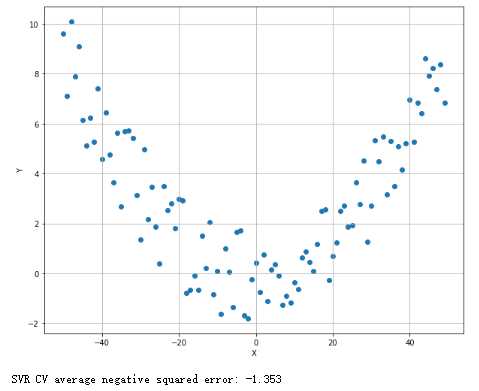
支持向量回归:

 1 from __future__ import print_function
 2 import numpy as np
 3 import matplotlib.pyplot as plt
 4 from sklearn.svm import SVR
 5 from sklearn.model_selection import cross_val_score
 6 # For reproducibility
 7 np.random.seed(1000)
 8 nb_samples = 50
 9 def show_dataset(X, Y):
10     fig, ax = plt.subplots(1, 1, figsize=(10, 8))
11     ax.grid()
12     ax.set_xlabel(‘X‘)
13     ax.set_ylabel(‘Y‘)
14     ax.scatter(X, Y)
15     plt.show()
16
17 if __name__ == ‘__main__‘:
18     # Create dataset
19     X = np.arange(-nb_samples, nb_samples, 1)
20     Y = np.zeros(shape=(2 * nb_samples,))
21     for x in X:
22         Y[int(x) + nb_samples] = np.power(x * 6, 2.0) / 1e4 + np.random.uniform(-2, 2)
23     # Show dataset
24     #show_dataset(X, Y)
25     # Create and train a Support Vector regressor
26     svr = SVR(kernel=‘poly‘, degree=2, C=1.5, epsilon=0.5)
27     svr_scores = cross_val_score(svr, X.reshape((nb_samples*2, 1)), Y, scoring=‘neg_mean_squared_error‘, cv=10)
28     print(‘SVR CV average negative squared error: %.3f‘ % svr_scores.mean())
决策树和集成学习:
二元决策:
不纯度的衡量:基尼不纯度指数、交叉熵不纯度指数、误分类不纯度指数
特征重要度:

 1 from __future__ import print_function
 2
 3 import numpy as np
 4
 5 from sklearn.datasets import make_classification
 6 from sklearn.tree import DecisionTreeClassifier, export_graphviz
 7 from sklearn.model_selection import cross_val_score
 8
 9
10 # For reproducibility
11 np.random.seed(1000)
12
13 nb_samples = 500
14
15 # Set a folder to store the graph in
16 graph_folder = ‘‘
17
18
19 if __name__ == ‘__main__‘:
20     # Create dataset
21     X, Y = make_classification(n_samples=nb_samples, n_features=3, n_informative=3, n_redundant=0, n_classes=3,
22                                n_clusters_per_class=1)
23
24     # Create a Decision tree classifier
25     dt = DecisionTreeClassifier()
26     dt_scores = cross_val_score(dt, X, Y, scoring=‘accuracy‘, cv=10)
27     print(‘Decision tree score: %.3f‘ % dt_scores.mean())
28
29     # Save in Graphviz format
30     dt.fit(X, Y)
31
32     with open(‘dt.dot‘, ‘w‘) as df:
33         df = export_graphviz(dt, out_file=df,
34                              feature_names=[‘A‘, ‘B‘, ‘C‘],
35                              class_names=[‘C1‘, ‘C2‘, ‘C3‘])

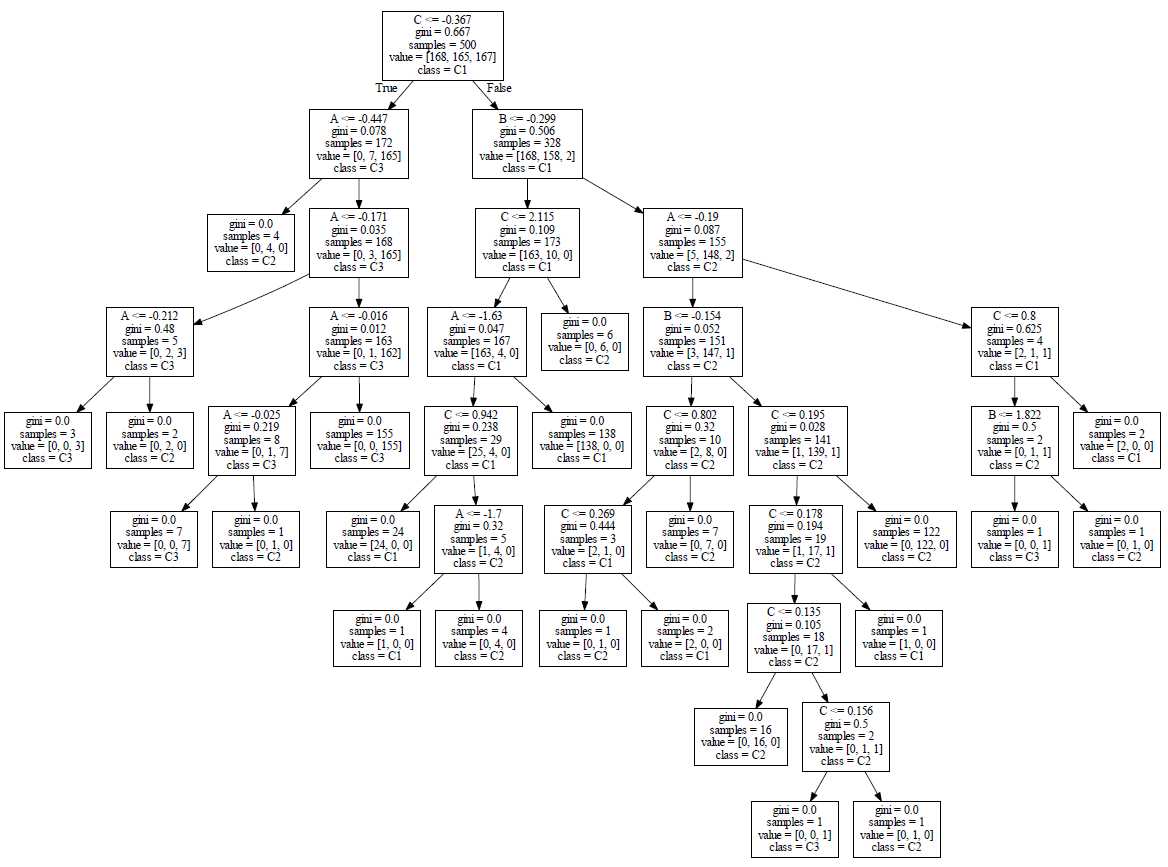
Graphviz下载后,windows安装后,找到目录下的:bin下的:dot,加入环境变量path,然后在cmd中输入:dot -Tpdf dt.dot dt.pdf,将dt.dot转化为dt.pdf,可视化图:

 1 from __future__ import print_function
 2 import numpy as np
 3 import multiprocessing
 4 from sklearn.datasets import load_digits
 5 from sklearn.tree import DecisionTreeClassifier
 6 from sklearn.model_selection import GridSearchCV
 7 # For reproducibility
 8 np.random.seed(1000)
 9
10 if __name__ == ‘__main__‘:
11     # Load dataset
12     digits = load_digits()
13     # Define a param grid
14     param_grid = [
15         {
16             ‘criterion‘: [‘gini‘, ‘entropy‘],
17             ‘max_features‘: [‘auto‘, ‘log2‘, None],
18             ‘min_samples_split‘: [2, 10, 25, 100, 200],
19             ‘max_depth‘: [5, 10, 15, None]
20         }
21     ]
22     # Create and train a grid searh
23     gs = GridSearchCV(estimator=DecisionTreeClassifier(), param_grid=param_grid,
24                       scoring=‘accuracy‘, cv=10, n_jobs=multiprocessing.cpu_count())
25     gs.fit(digits.data, digits.target)
26     print(gs.best_estimator_)
27     print(‘Decision tree score: %.3f‘ % gs.best_score_)

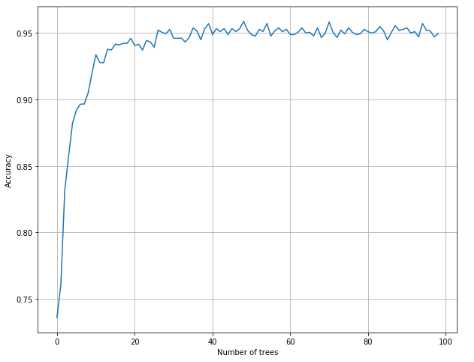
随机森林:

 1 from __future__ import print_function
 2
 3 import numpy as np
 4 import matplotlib.pyplot as plt
 5
 6 from sklearn.datasets import load_digits
 7 from sklearn.ensemble import RandomForestClassifier
 8 from sklearn.model_selection import cross_val_score
 9
10
11 # For reproducibility
12 np.random.seed(1000)
13
14 nb_classifications = 100
15
16
17 if __name__ == ‘__main__‘:
18     # Load dataset
19     digits = load_digits()
20
21     # Collect accuracies
22     rf_accuracy = []
23
24     for i in range(1, nb_classifications):
25         a = cross_val_score(RandomForestClassifier(n_estimators=i), digits.data, digits.target, scoring=‘accuracy‘,
26                             cv=10).mean()
27         rf_accuracy.append(a)
28
29     # Show results
30     plt.figure(figsize=(10, 8))
31     plt.xlabel(‘Number of trees‘)
32     plt.ylabel(‘Accuracy‘)
33     plt.grid(True)
34     plt.plot(rf_accuracy)
35     plt.show()

 1 from __future__ import print_function
 2
 3 import numpy as np
 4 import matplotlib.pyplot as plt
 5
 6 from sklearn.datasets import load_digits
 7 from sklearn.ensemble import ExtraTreesClassifier
 8 from sklearn.model_selection import cross_val_score
 9
10
11 # For reproducibility
12 np.random.seed(1000)
13
14 nb_classifications = 100
15
16
17 if __name__ == ‘__main__‘:
18     # Load dataset
19     digits = load_digits()
20
21     # Collect accuracies
22     et_accuracy = []
23
24     for i in range(1, nb_classifications):
25         a = cross_val_score(ExtraTreesClassifier(n_estimators=i), digits.data, digits.target, scoring=‘accuracy‘,
26                             cv=10).mean()
27         et_accuracy.append(a)
28
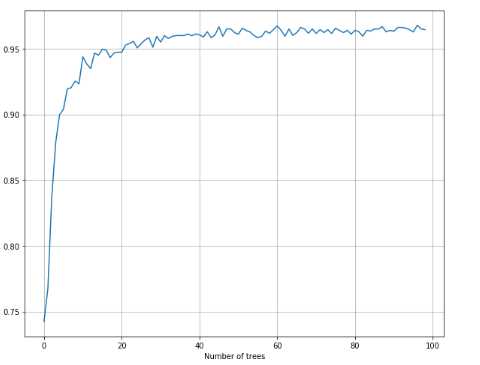
29     # Show results
30     plt.figure(figsize=(10, 8))
31     plt.xlabel(‘Number of trees‘)
32     plt.ylabel(‘Accuracy‘)
33     plt.grid(True)
34     plt.plot(et_accuracy)
35     plt.show()
AdaBoost:

 1 from __future__ import print_function
 2
 3 import numpy as np
 4 import matplotlib.pyplot as plt
 5
 6 from sklearn.datasets import load_digits
 7 from sklearn.ensemble import AdaBoostClassifier
 8 from sklearn.model_selection import cross_val_score
 9
10
11 # For reproducibility
12 np.random.seed(1000)
13
14 nb_classifications = 100
15
16
17 if __name__ == ‘__main__‘:
18     # Load dataset
19     digits = load_digits()
20
21     # Collect accuracies
22     ab_accuracy = []
23
24     for i in range(1, nb_classifications):
25         a = cross_val_score(AdaBoostClassifier(n_estimators=i), digits.data, digits.target, scoring=‘accuracy‘,
26                             cv=10).mean()
27         ab_accuracy.append(a)
28
29     # Show results
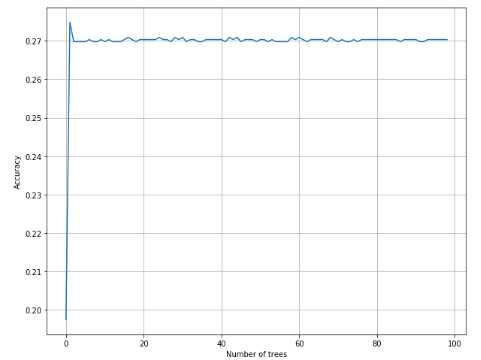
30     plt.figure(figsize=(10, 8))
31     plt.xlabel(‘Number of trees‘)
32     plt.ylabel(‘Accuracy‘)
33     plt.grid(True)
34     plt.plot(ab_accuracy)
35     plt.show()

 1 from __future__ import print_function
 2
 3 import numpy as np
 4
 5 from sklearn.datasets import load_iris
 6 from sklearn.ensemble import AdaBoostClassifier
 7 from sklearn.model_selection import cross_val_score
 8
 9
10 # For reproducibility
11 np.random.seed(1000)
12
13
14 if __name__ == ‘__main__‘:
15     # Load dataset
16     iris = load_iris()
17
18     # Create and train an AdaBoost classifier
19     ada = AdaBoostClassifier(n_estimators=100, learning_rate=1.0)
20     ada_scores = cross_val_score(ada, iris.data, iris.target, scoring=‘accuracy‘, cv=10)
21     print(‘AdaBoost score: %.3f‘ % ada_scores.mean())

梯度树提升:

 1 from __future__ import print_function
 2
 3 import numpy as np
 4 import matplotlib.pyplot as plt
 5
 6 from sklearn.datasets import make_classification
 7 from sklearn.ensemble import GradientBoostingClassifier
 8 from sklearn.model_selection import cross_val_score
 9
10 # For reproducibility
11 np.random.seed(1000)
12
13 nb_samples = 500
14
15 if __name__ == ‘__main__‘:
16     # Create the dataset
17     X, Y = make_classification(n_samples=nb_samples, n_features=4, n_informative=3, n_redundant=1, n_classes=3)
18
19     # Collect the scores for n_estimators in (1, 50)
20     a = []
21     max_estimators = 50
22
23     for i in range(1, max_estimators):
24         score = cross_val_score(GradientBoostingClassifier(n_estimators=i, learning_rate=10.0 / float(i)), X, Y,
25                                      cv=10, scoring=‘accuracy‘).mean()
26         a.append(score)
27
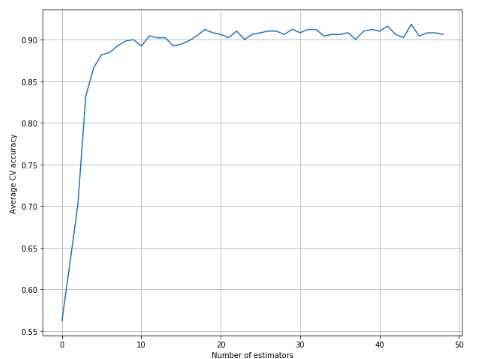
28     # Plot the results
29     plt.figure(figsize=(10, 8))
30     plt.xlabel(‘Number of estimators‘)
31     plt.ylabel(‘Average CV accuracy‘)
32     plt.grid(True)
33     plt.plot(a)
34     plt.show()
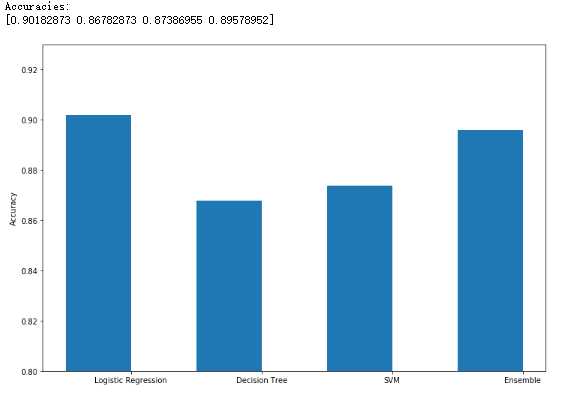
投票分类器:

 1 from __future__ import print_function
 2
 3 import numpy as np
 4 import matplotlib.pyplot as plt
 5
 6 from sklearn.datasets import make_classification
 7 from sklearn.linear_model import LogisticRegression
 8 from sklearn.svm import SVC
 9 from sklearn.tree import DecisionTreeClassifier
10 from sklearn.ensemble import VotingClassifier
11 from sklearn.model_selection import cross_val_score
12
13 # For reproducibility
14 np.random.seed(1000)
15
16 nb_samples = 500
17
18
19 def compute_accuracies(lr, dt, svc, vc, X, Y):
20     accuracies = []
21
22     accuracies.append(cross_val_score(lr, X, Y, scoring=‘accuracy‘, cv=10).mean())
23     accuracies.append(cross_val_score(dt, X, Y, scoring=‘accuracy‘, cv=10).mean())
24     accuracies.append(cross_val_score(svc, X, Y, scoring=‘accuracy‘, cv=10).mean())
25     accuracies.append(cross_val_score(vc, X, Y, scoring=‘accuracy‘, cv=10).mean())
26
27     print(‘Accuracies:‘)
28     print(np.array(accuracies))
29
30     return accuracies
31
32
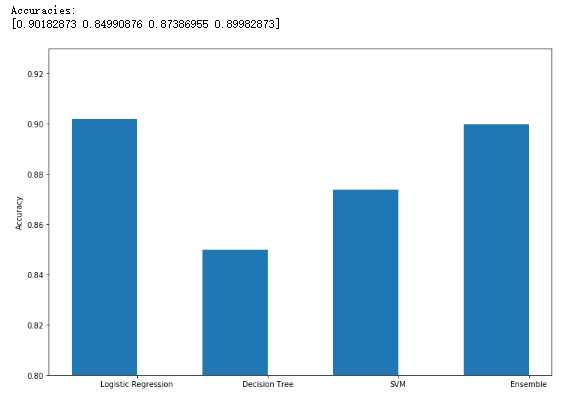
33 def plot_accuracies(accuracies):
34     fig, ax = plt.subplots(figsize=(12, 8))
35     positions = np.array([0, 1, 2, 3])
36
37     ax.bar(positions, accuracies, 0.5)
38     ax.set_ylabel(‘Accuracy‘)
39     ax.set_xticklabels((‘Logistic Regression‘, ‘Decision Tree‘, ‘SVM‘, ‘Ensemble‘))
40     ax.set_xticks(positions + (5.0 / 20))
41     plt.ylim([0.80, 0.93])
42     plt.show()
43
44
45 if __name__ == ‘__main__‘:
46     # Create the dataset
47     X, Y = make_classification(n_samples=nb_samples, n_features=2, n_redundant=0, n_classes=2)
48
49     # Show the dataset
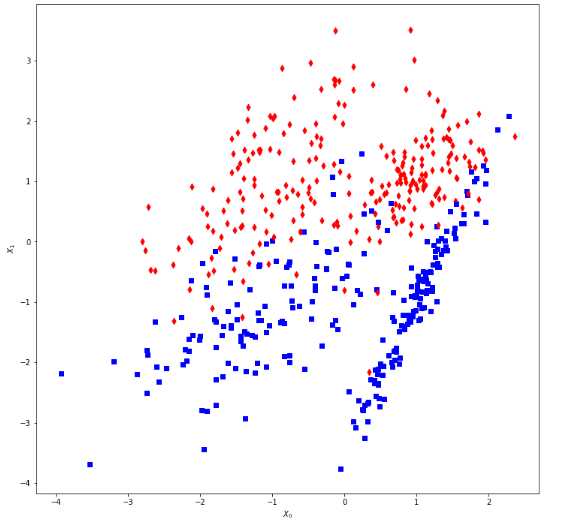
50     fig, ax = plt.subplots(figsize=(12, 12))
51
52     for i, x in enumerate(X):
53         if Y[i] == 0:
54             ax.scatter(x[0], x[1], marker=‘s‘, color=‘blue‘)
55         else:
56             ax.scatter(x[0], x[1], marker=‘d‘, color=‘red‘)
57
58     ax.set_xlabel(r‘$X_0$‘)
59     ax.set_ylabel(r‘$X_1$‘)
60     plt.show()
61
62     # Create the classifiers
63     lr = LogisticRegression()
64     svc = SVC(kernel=‘poly‘, probability=True)
65     dt = DecisionTreeClassifier()
66
67     classifiers = [(‘lr‘, lr),
68                    (‘dt‘, dt),
69                    (‘svc‘, svc)]
70
71     # Hard voting
72     vc = VotingClassifier(estimators=classifiers, voting=‘hard‘)
73
74     # Compute and plot accuracies
75     hard_accuracies = compute_accuracies(lr, dt, svc, vc, X, Y)
76     plot_accuracies(hard_accuracies)
77
78     # Soft weighted voting
79     weights = [1.5, 0.5, 0.75]
80
81     vc = VotingClassifier(estimators=classifiers, weights=weights, voting=‘soft‘)
82
83     # Compute and plot accuracies
84     soft_accuracies = compute_accuracies(lr, dt, svc, vc, X, Y)
85     plot_accuracies(soft_accuracies)
看不懂也看不进去,希望以后还有的话,再看看吧.....
标签:val lower sem sub classes play lap main noi
原文地址:https://www.cnblogs.com/bai2018/p/10584678.html