标签:接下来 nbsp 保存 data 手动 not stroke function attr
1 function x(d){
2 return d[0]       //第一个值是x坐标
3 }
4
5 function y(d){
6 return d[1]       //第二个值是y坐标
7 }
1 <line x1="20" y1="20" x2="300" y2="100" />
1  svg.append("line")
2             .attr("x1",20)
3             .attr("y1",20)
4             .attr("x2",300)
5             .attr("y2",100)
1 <path d="M20,20L300,100" />
1 svg.append("path")
2             .attr("d","M20,20L300,100")
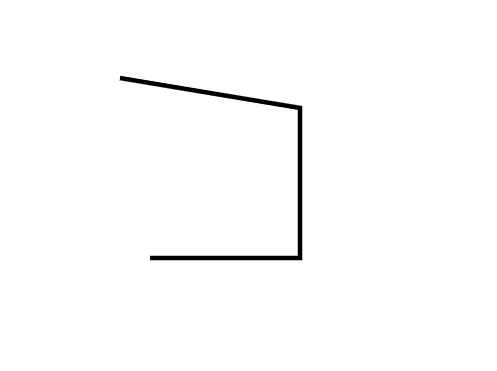
 1 //创建一个svg画图区域
 2         var svg = d3.select("#body")
 3                     .append("svg")
 4                     .attr("width",600)
 5                     .attr("height",400)
 6
 7         //线段的点数据,每一项是一个点的x和y坐标
 8         var lines = [[80,80],[200,100],[200,200],[100,200]]
 9         //创建一个线段生成器
10         var linePath = d3.svg.line()
11
12         //添加路径
13         svg.append("path")
14             .attr("d",linePath(lines))      //使用了线段生成器
15             .attr("stroke","black")         //线的颜色
16             .attr("stroke-width","3px")     //线的宽度
17             .attr("fill","none")            //填充颜色为none
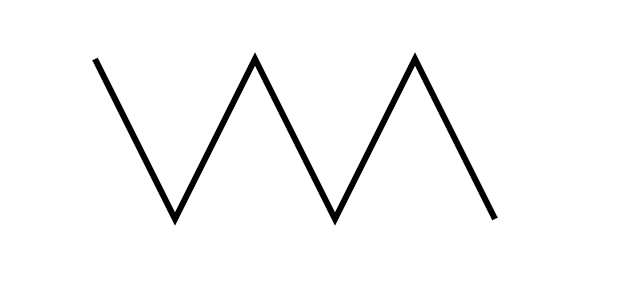
 1  //创建一个svg画图区域
 2         var svg = d3.select("#body")
 3                     .append("svg")
 4                     .attr("width",600)
 5                     .attr("height",400)
 6
 7
 8         var lines = [80,120,160,200,240,280]
 9         var linePath = d3.svg.line()
10                         .x(function(d){return d})
11                         .y(function(d,i){
12                             return i%2 == 0? 40 : 120
13                         })
14
15         //添加路径
16         svg.append("path")
17             .attr("d",linePath(lines))      //使用了线段生成器
18             .attr("stroke","black")         //线的颜色
19             .attr("stroke-width","3px")     //线的宽度
20             .attr("fill","none")            //填充颜色为none
1 var linePath = d3.svg.line()
2                 .interpolate("linear-closed")
1 function interpolateLinear(points){
2     return points.join("L")
3 }
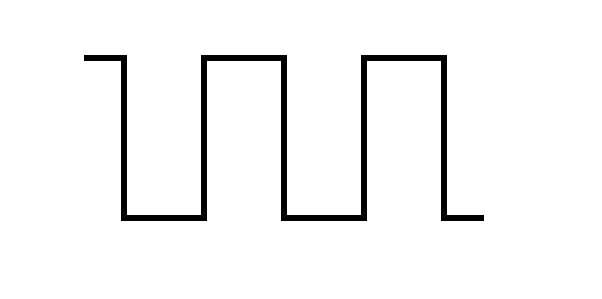
 1  //创建一个svg画图区域
 2         var svg = d3.select("#body")
 3                     .append("svg")
 4                     .attr("width",600)
 5                     .attr("height",400)
 6
 7
 8         //step插值模式
 9         var lines = [80,120,160,200,240,280]
10         var linePath = d3.svg.line()
11                         .interpolate("step")
12                         .x(function(d){return d})
13                         .y(function(d,i){
14                             return i%2 == 0? 40 : 120
15                         })
16
17
18         //添加路径
19         svg.append("path")
20             .attr("d",linePath(lines))      //使用了线段生成器
21             .attr("stroke","black")         //线的颜色
22             .attr("stroke-width","3px")     //线的宽度
23             .attr("fill","none")            //填充颜色为none
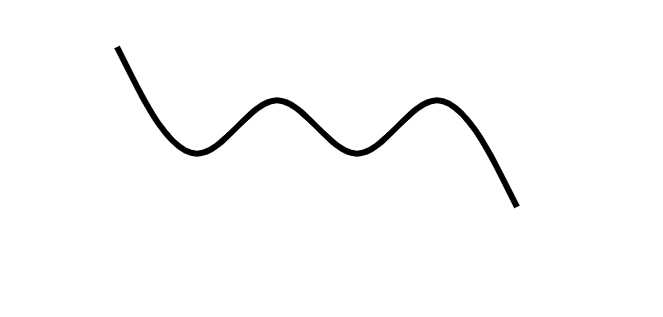
 1 //创建一个svg画图区域
 2         var svg = d3.select("#body")
 3                     .append("svg")
 4                     .attr("width",600)
 5                     .attr("height",400)
 6
 7
 8         //basis插值模式
 9         var lines = [80,120,160,200,240,280]
10         var linePath = d3.svg.line()
11                         .interpolate("basis")
12                         .x(function(d){return d})
13                         .y(function(d,i){
14                             return i%2 == 0? 40 : 120
15                         })
16
17         //添加路径
18         svg.append("path")
19             .attr("d",linePath(lines))      //使用了线段生成器
20             .attr("stroke","black")         //线的颜色
21             .attr("stroke-width","3px")     //线的宽度
22             .attr("fill","none")            //填充颜色为none
 1  //创建一个svg画图区域
 2         var svg = d3.select("#body")
 3                     .append("svg")
 4                     .attr("width",600)
 5                     .attr("height",400)
 6
 7          //cardinal插值模式
 8          var lines = [80,120,160,200,240,280]
 9          var linePath = d3.svg.line()
10                          .interpolate("cardinal")
11                          .x(function(d){return d})
12                          .y(function(d,i){
13                              return i%2 == 0? 40 : 120
14                          })
15
16
17         //添加路径
18         svg.append("path")
19             .attr("d",linePath(lines))      //使用了线段生成器
20             .attr("stroke","black")         //线的颜色
21             .attr("stroke-width","3px")     //线的宽度
22             .attr("fill","none")            //填充颜色为none
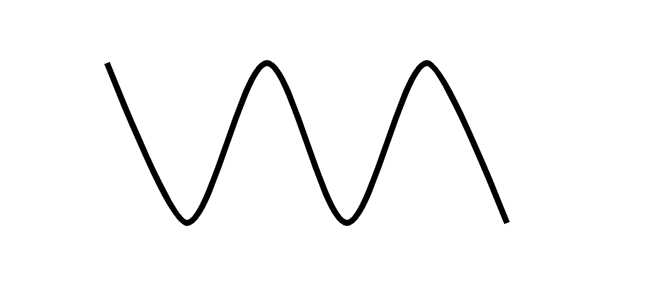
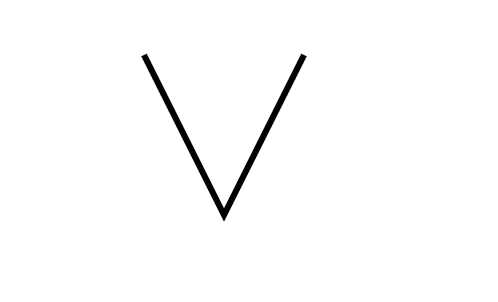
 1   //创建一个svg画图区域
 2         var svg = d3.select("#body")
 3                     .append("svg")
 4                     .attr("width",600)
 5                     .attr("height",400)
 6
 7         //选择性的使用顶点数据
 8         var lines = [80,120,160,200,240,280]
 9         var linePath = d3.svg.line()
10                         .x(function(d){return d})
11                         .y(function(d,i){
12                             return i%2 == 0 ? 40 : 120
13                         })
14                         .defined(function(d){
15                             return d < 200
16                         })
17
18         //添加路径
19         svg.append("path")
20             .attr("d",linePath(lines))      //使用了线段生成器
21             .attr("stroke","black")         //线的颜色
22             .attr("stroke-width","3px")     //线的宽度
23             .attr("fill","none")            //填充颜色为none
效果图 :
标签:接下来 nbsp 保存 data 手动 not stroke function attr
原文地址:https://www.cnblogs.com/littleSpill/p/10850364.html