标签:img into most problems dia tps div ros operation
Lesson outline
Here‘s an overview of what you‘ll learn to do in this lesson. Documentation links are for reference.
Hit Next to continue.
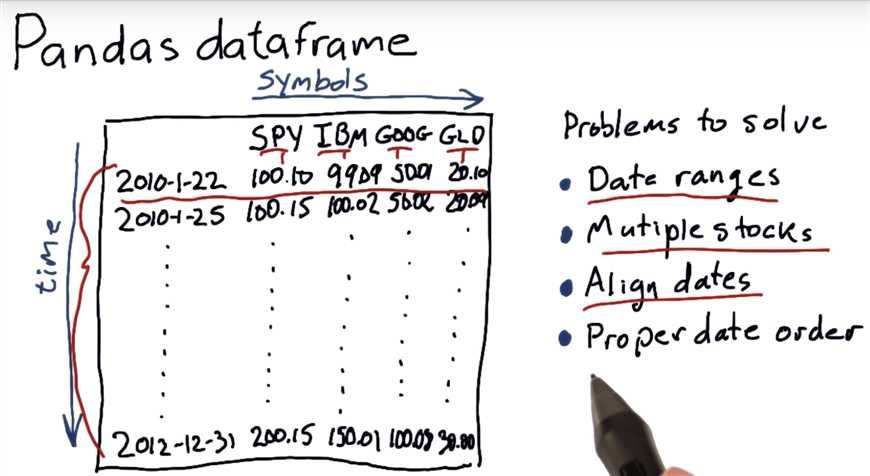
Pandas dataframe recap
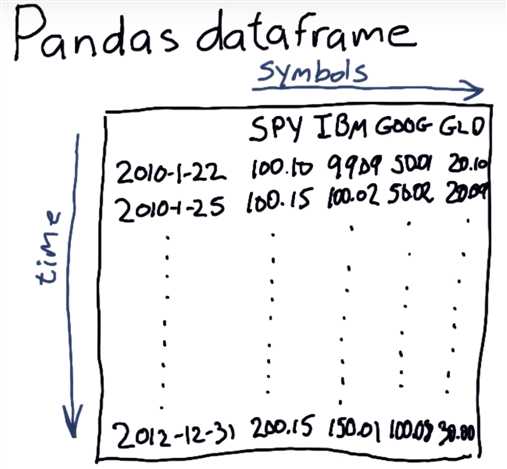
Problems to solve
NYSE trading days

See if you can find the number of trading days here: www.nyse.com/markets/hours-calendars
Note that we are interested in the number of trading days (i.e. days the market conducted trading) for US Equities during 2014
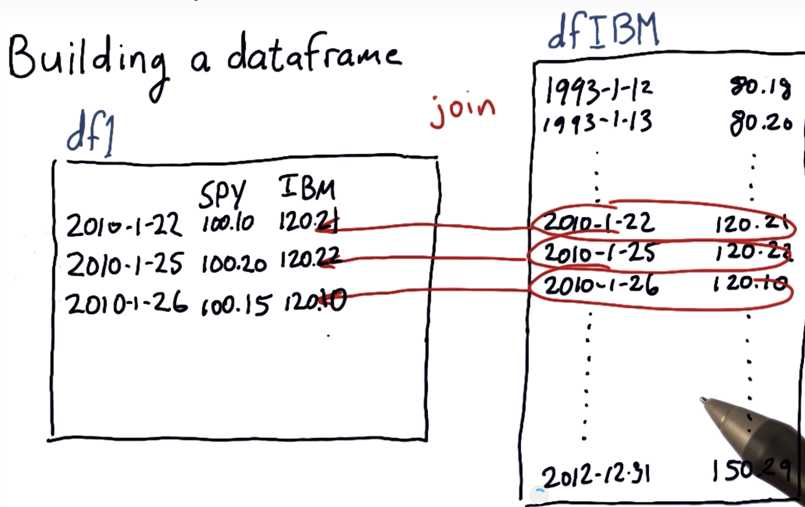
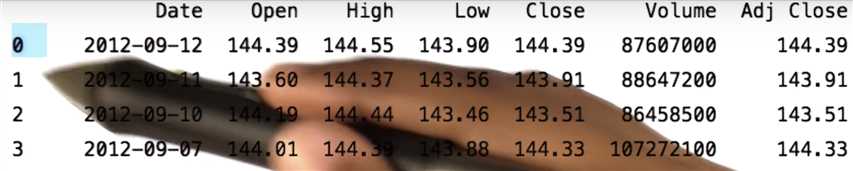
Building a dataframe
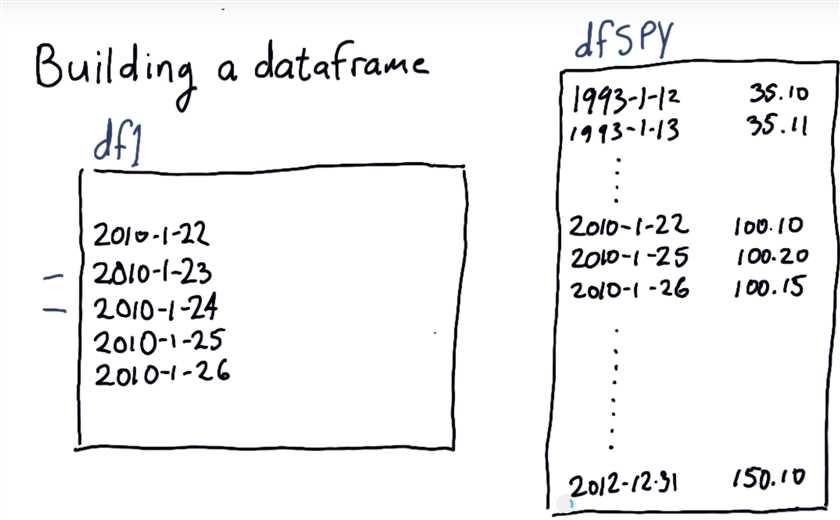
S&P 500 is a stock market index based on 500 large American companies listed on the NYSE or NASDAQ. Think of it as a weighted mean of the stock prices of the companies, where the number of shares are used as weights (with some adjustment for any events that may affect apparent stock value, such as splits).
SPDR® S&P 500 is an ETF (or exchange-traded fund) that tracks the S&P 500 index, and is itself listed on NYSE under the ticker symbol "SPY".
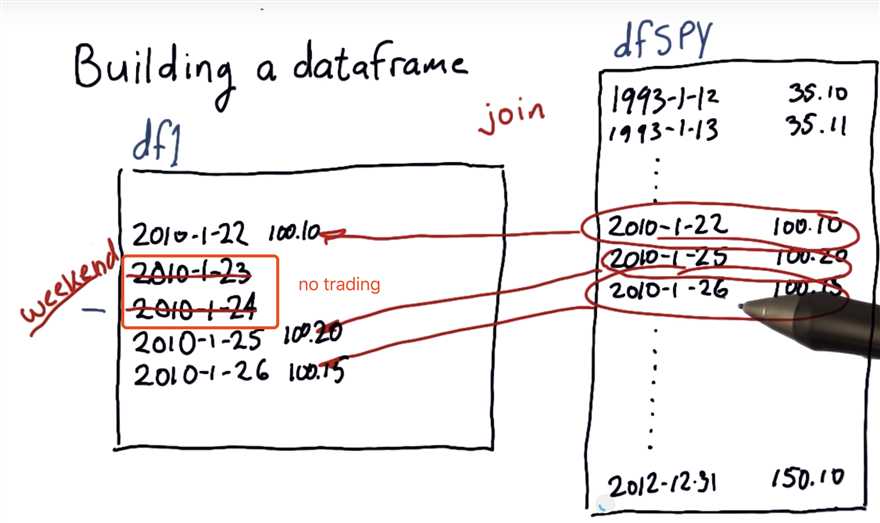
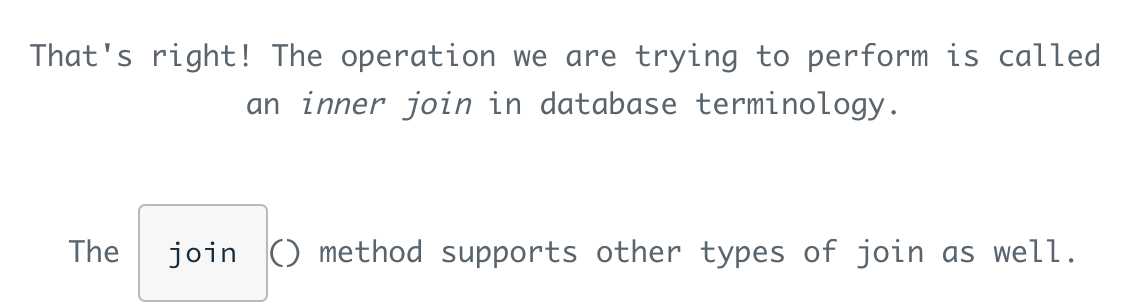
"Joining" dataframes
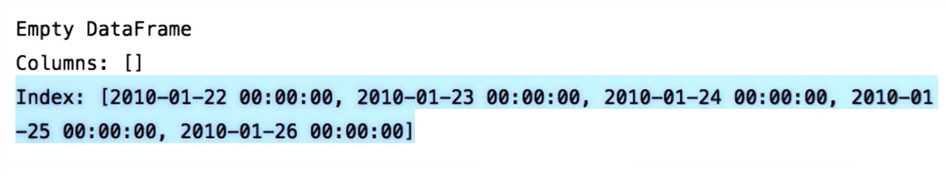
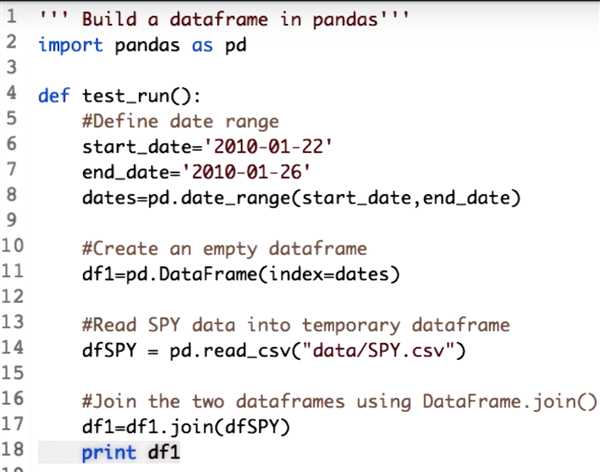
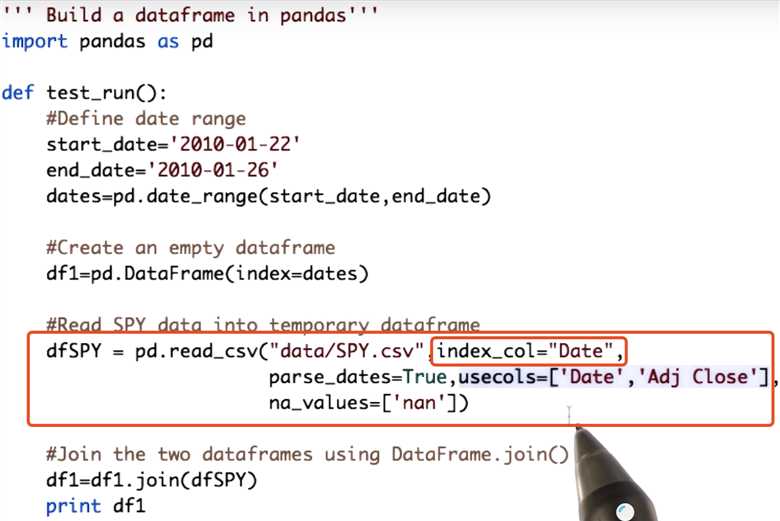
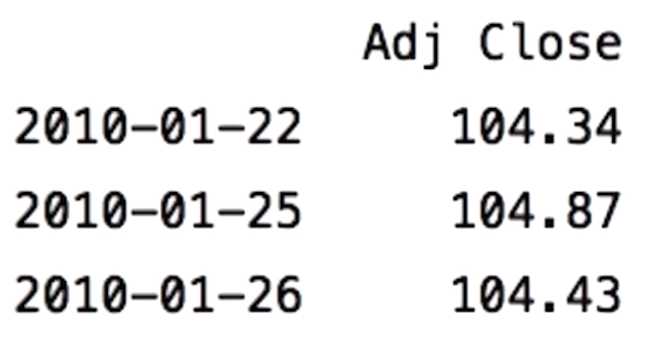
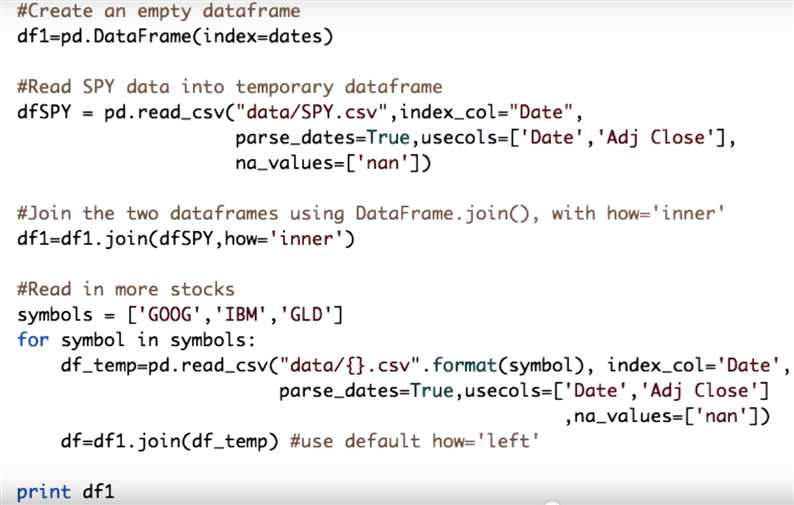
Create an empty data frame

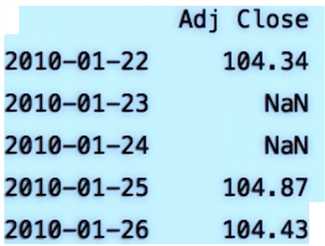
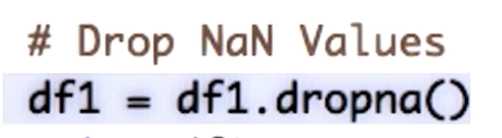
Join SPY data
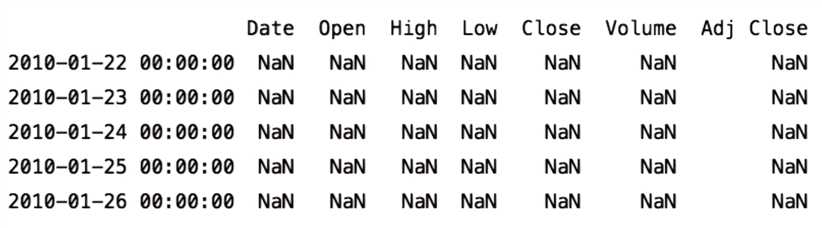
NaN because SPY.cvs uses integers as index

Documentation: pandas.DataFrame.join
Look for the how parameter.
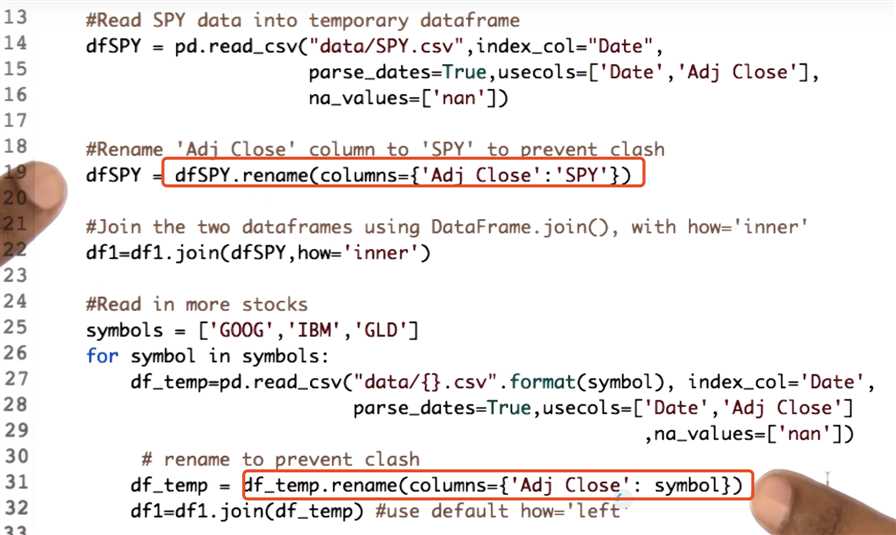
Read in more stocks
![]()
what‘s wrong?
Utility functions for reading data
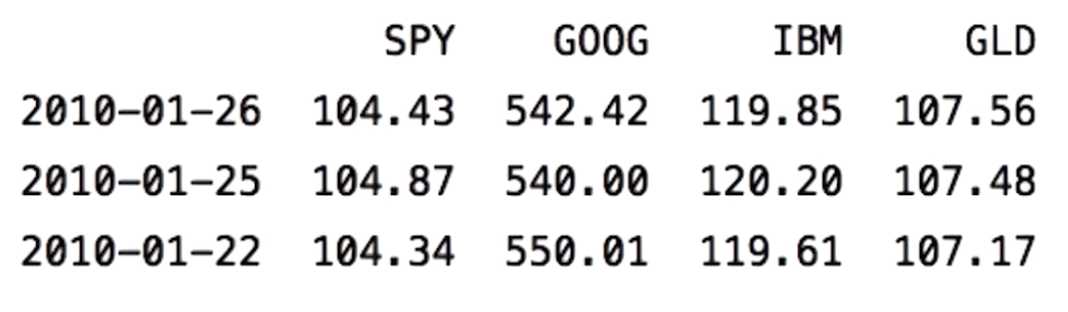
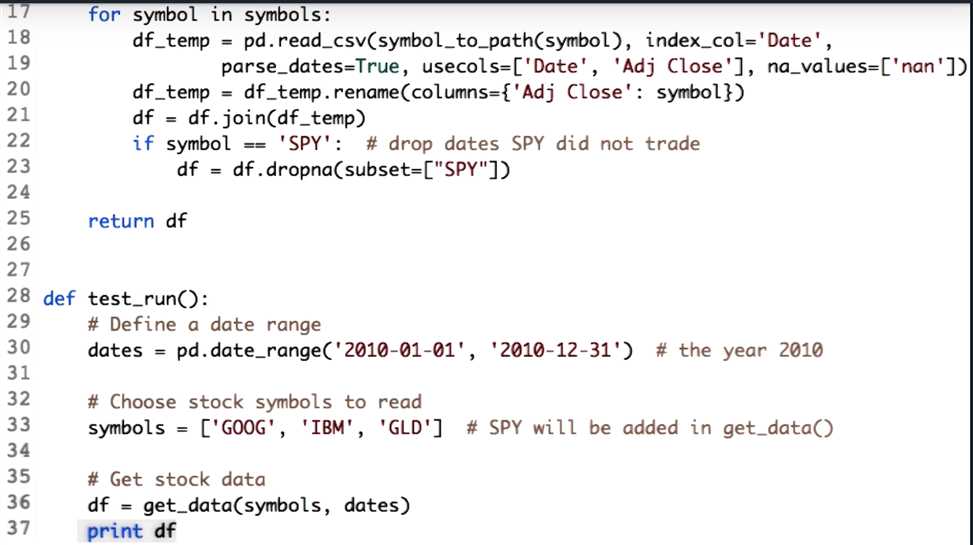
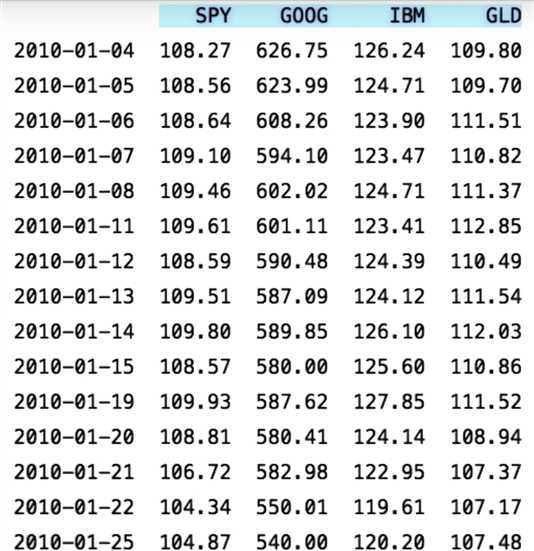
"""Utility functions"""

import os
import pandas as pd

def symbol_to_path(symbol, base_dir="data"):
    """Return CSV file path given ticker symbol."""
    return os.path.join(base_dir, "{}.csv".format(str(symbol)))


def get_data(symbols, dates):
    """Read stock data (adjusted close) for given symbols from CSV files."""
    df = pd.DataFrame(index=dates)
    if ‘SPY‘ not in symbols:  # add SPY for reference, if absent
        symbols.insert(0, ‘SPY‘)

    for symbol in symbols:
        # TODO: Read and join data for each symbol
        df2 = pd.read_csv(symbol_to_path(symbol),index_col="Date",parse_dates=True,usecols=[‘Date‘,‘Adj Close‘],na_values=[‘nan‘])
        df2 = df2.rename(columns={‘Adj Close‘: symbol})
        df = df.join(df2)

    return df.dropna()


def test_run():
    # Define a date range
    dates = pd.date_range(‘2010-01-22‘, ‘2010-01-26‘)

    # Choose stock symbols to read
    symbols = [‘GOOG‘, ‘IBM‘, ‘GLD‘]

    # Get stock data
    df = get_data(symbols, dates)
    print df


if __name__ == "__main__":
    test_run()
Documentation:
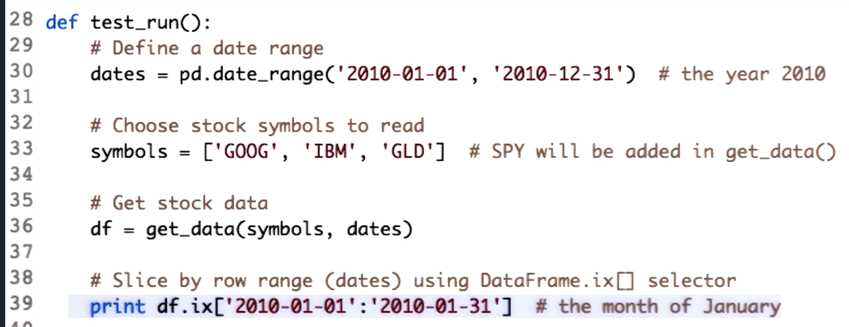
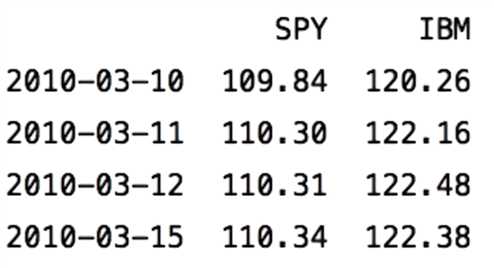
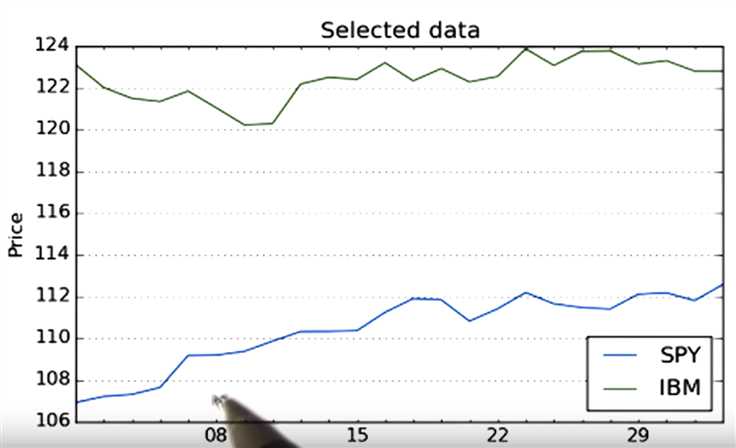
Obtaining a slice of data


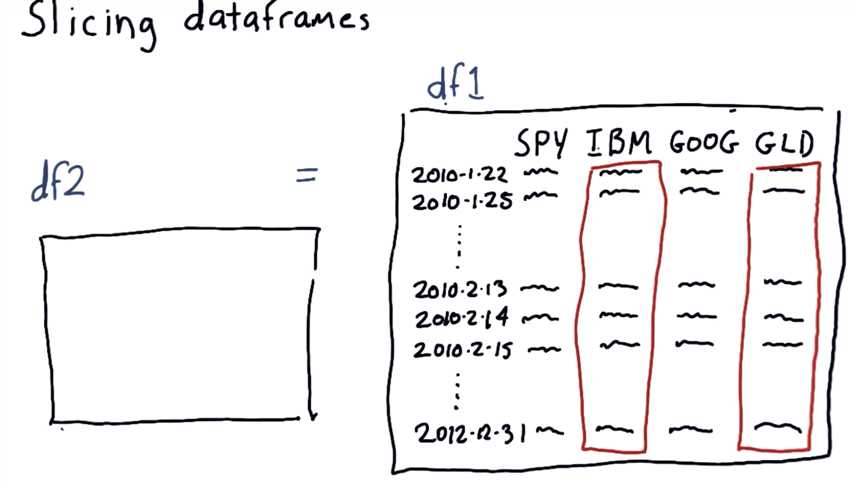
More slicing


Problems with plotting
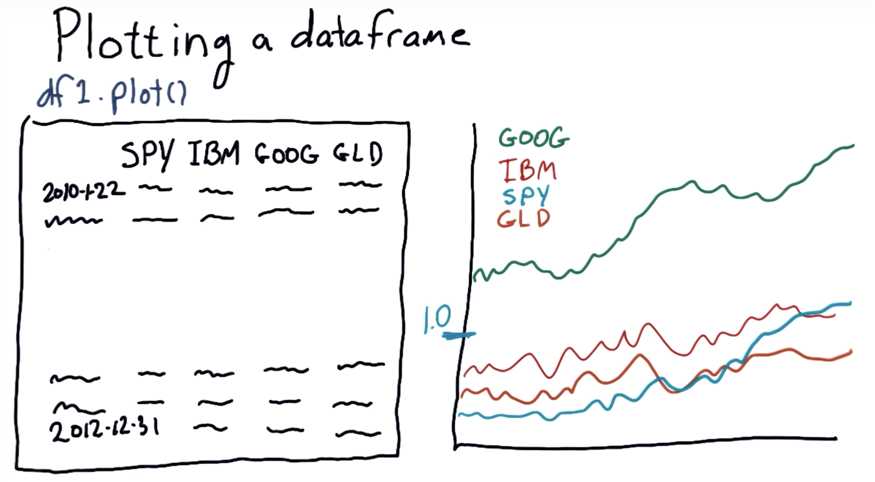

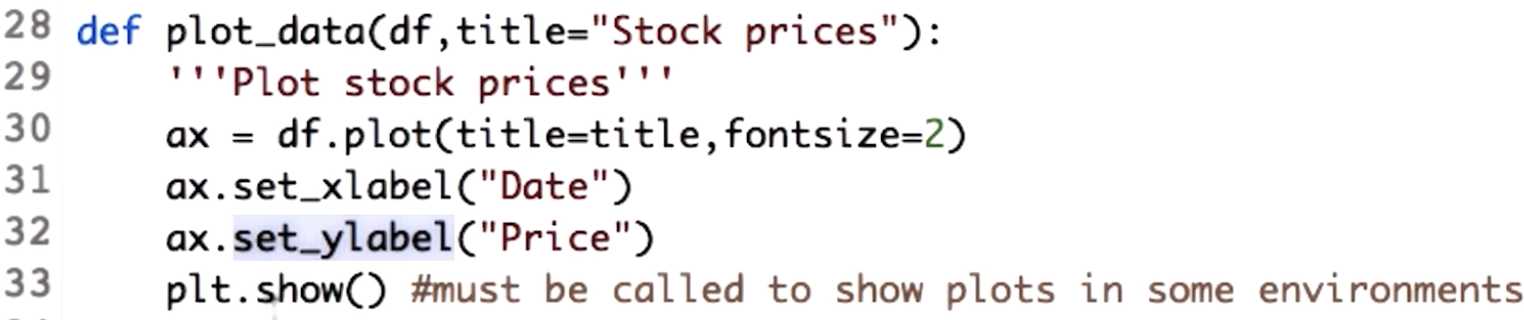
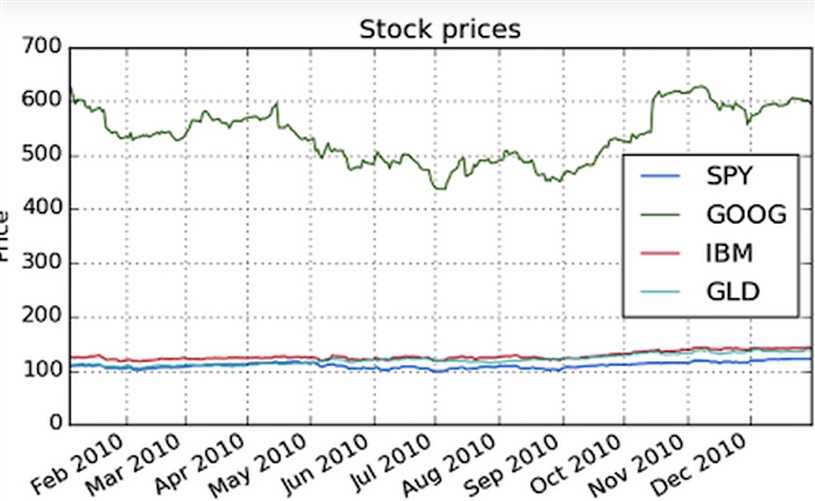
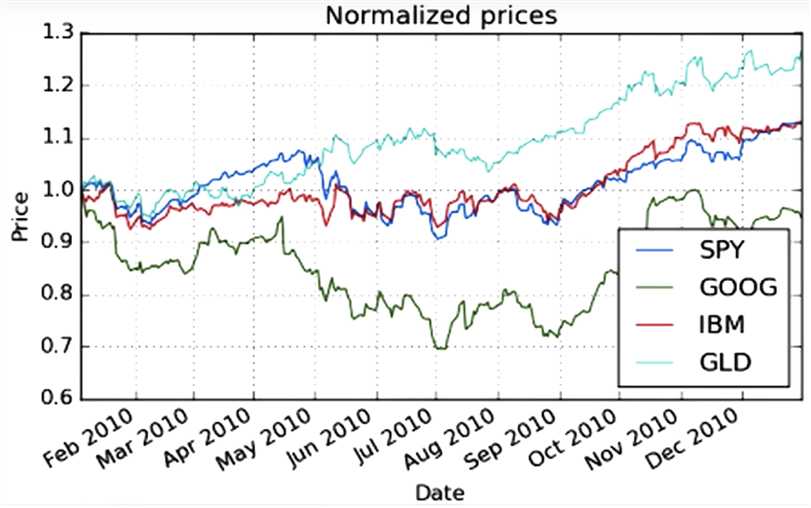
Plotting multiple stocks
Carly Fiorina was named "the most powerful woman in business" by Forbes in 1998, while at AT&T/Lucent. She was the CEO of HP from 1999-2005, and has held several leadership positions at technology firms and business institutes.
Listen to her talk about The Importance of Selective Information as part of Stanford‘s Entrepreneurial Thought Leaders Lecture series [full podcast].
Some of her popular quotes can be found here.

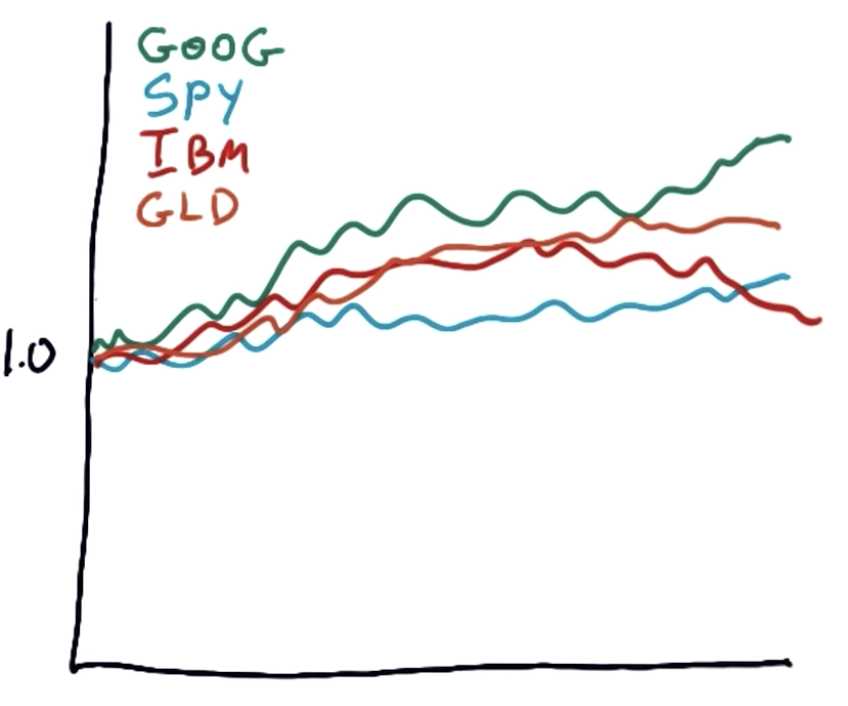
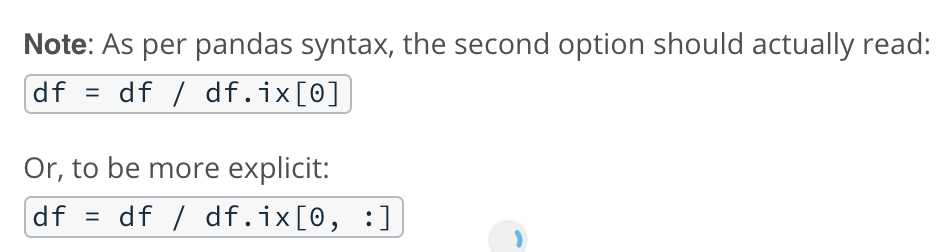
Normalizing
Hit Next to continue.
[Machine Learning for Trading] {ud501} Lesson 3: 01-02 Working with multiple stocks
标签:img into most problems dia tps div ros operation
原文地址:https://www.cnblogs.com/ecoflex/p/10971500.html