标签:sock rsh lamp环境 processes wap 方便 本地 hat sql
目录
数据采集、数据保存、图像展示、报警系统
Cacti:
Cacti是一套基于PHP、MySQL、[^ SNMP]、[^ RRDTool]开发端监测图像分析工具。它提供了非常强大端数据和用户管理功能。Cacti监控关注端是对数据端展示,却不关注数据异常后端反馈。
Nagios:
Nagios是一款开源端免费网络监控报警服务,能有效监控Windows、Linux和Unix端主机状态,交换机、路由器和防火墙等网络设置,在系统或服务状态异常时发出邮件或短信报警第一时间通知运维人员,在状态恢复后发出正常端邮件或短信通知。Nagios有完善端插件功能,可以方便端根据应用服务扩展功能。
Zabbix:Zabbix是一个基于WEB界面的提供分布式监控以及网络监视功能端企业级端开源解决方案
[^ SNMP]: (简单网络管理协议,用以监测连接到网络上端设备是否有任何引起管理上关注端情况)
[^ RRDTool]: (Round Robin Database Tool,强大的绘图引擎)
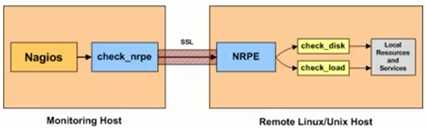
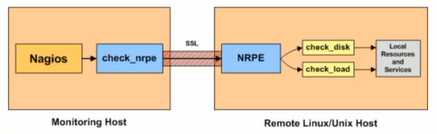
说明:NRPE是nagios的一个功能扩展,可在远程主机上执行插件程序。通过在远程服务器上安装NRPE插件及Nagios插件程序来向Nagios监控平台提供该服务器端本地情况,如CPU负载,内存使用,磁盘使用等。

当Nagios需要进行对主机和服务进行状态检测时,它将需要检测的信息传给一个插件,由插件来检测主机或服务并给出一个可供进一步运行的状态,将结果返回Nagios守护进程。Nagios按照主机或服务的结果来做适当动作(如发出警告等)
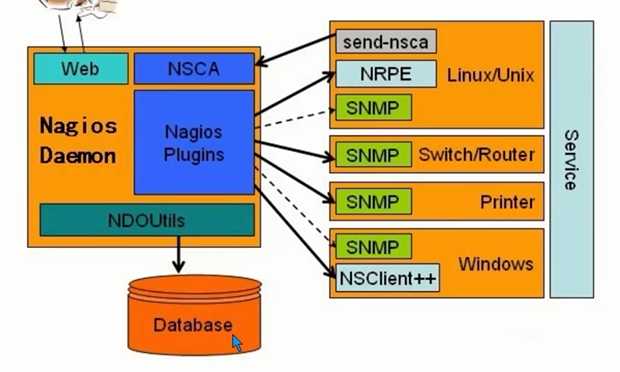
Nagios有许多“外部构件”软件包可供使用。外部构件可以扩展Nagios的应用并使之与其他软件集成。
gd-devel-2.0.35-11.el6.x86_64.rpm
GD-2.56.tar.gz
libgd-2.1.0.tar.gz
nagios-4.0.5.tar.gz
nagios-plugins-2.0.3.tar.gz
nagiosgraph-1.4.4.tar.gz
nrpe-2.12.tar.gz
rrdtool-1.4.8.tar.gz

mkdir /nagios
cp nagios-4.0.5.tar.gz nagios-plugins-2.0.3.tar.gz gd-devel-2.0.35-11.el6.x86_64.rpm /nagios/yum -y install gd mysql mysql-server php httpd* gcc glibc glibc-common mysql-devel
yum -y localinstall gd-devel-2.0.35-11.el6.x86_64.rpm
如果报错可以加:
--nogpgcheck 不检查软件包签名
启动mysql
service mysqld start
设置用户名和密码
mysqladmin -uroot -h localhost password '123'
mysql -uroot -p123
useradd nagios
groupadd nagiosgroup
usermod -G nagiosgroup nagios
usermod -G nagiosgroup apache
//你的web服务器由哪个用户跑,就把哪个用户也加到这个组
//找到你nagios相关软件包端存放路径,我在/nagios下
cd /nagios/
tar -xf nagios-4.0.5.tar.gz -C /usr/src/
cd /usr/src/nagios-4.0.5/
./configure --with-nagios-user=nagios --with-nagios-group=nagiosgroup --with-gd-lib=/usr/lib --with-gd-inc=/usr/include/
//编译
make all
//安装
make install 安装主程序,CGI脚本和web网页文件
make install-init 安装服务脚本/etc/init.d/nagios
make install-commandmode 修改一些相应端目录权限
make install-config 安装/usr/locl/nagios/etc这个目录(包含配置文件模板)
make install-webconf 安装/etc/httpd/conf.d/nagios.conf子配置文件
make install-exfoliation 安装exfoliation主题(也就是web皮肤和样式),会覆盖其他主题
make install-classicui 安装classicui主题,会覆盖其他主题
//安装完后查询相关目录内容
ls /usr/local/nagios/
bin etc libexec sbin share var
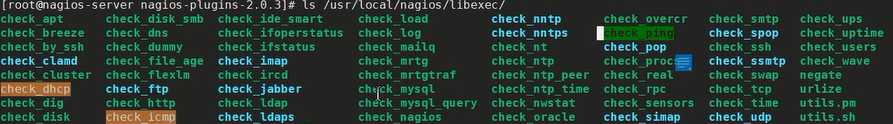
//libexec目录为空,需要安装插件包才会有很多命令与脚本
ls /usr/local/nagios/libexec/cd /nagios
tar -xf nagios-plugins-2.0.3.tar.gz -C /usr/src/
cd /usr/src/nagios-plugins-2.0.3/
./cnfigure --with-nagios-user=nagios --with-nagios-group=nagiosgroup --with-gd-lib=/usr/lib --with-gd-inc=/usr/include/
make
make install
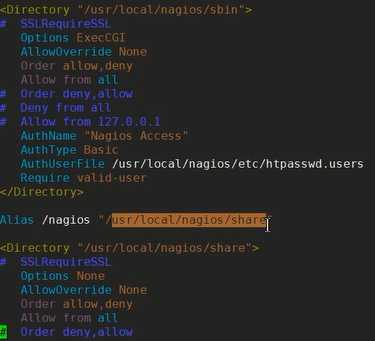
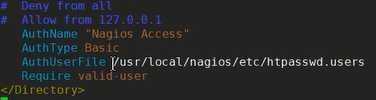
/etc/httpd/conf.d/nagios.conf   //这个文件里已经配置了nagios的apache验证,所以要把用户给创建出来

htpasswd -c /usr/local/nagios/etc/htpasswd.users nagiosadmin
New password:123
Re-type new password:123
Adding password for user nagiosadmin

//这里注意一下,用户名一定要用nagiosadmin,如果你用其他自定义的用户名,可以通过apache的验证,但是查看nagios数据时,会没有权限看到数据

# /usr/local/nagios/bin/nagios -v /usr/local/nagios/etc/nagios.cfg
//检测nagios配置文件正确性
/etc/init.d/nagios restart      service nagios start
/etc/init.d/httpd restart       service httpd start
注意:selinux关闭,否则可能造成图形看不到信息http://10.1.1.1/nagios/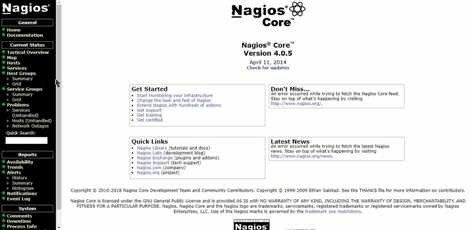
/usr/local/nagios/etc/nagios.cfg 主配置文件,核心配置文件
/usr/local/nagios/etc/resource.cfg nagios的资源或者变量定义文件
其中,变量$USR1$指定安装nagios插件的路径,如果把插件安装在了其他路径,只需在这里修改即可。需要注意的是,变量必须先定义,然后才能在其他配置文件中进行引用。
/usr/local/nagios/etc/cgi.cfg
此文件用来控制相关cgi脚本,如果想在nagios的web监控界面执行cgi脚本,如重启nagios进程、关闭nagios通知、停止nagios主机检测等,这时就需要配置cgi.cfg文件。
CGI:通用网关接口(Common Gateway Interface)是一个web服务器主机提供信息服务的标准接口,通过CGI接口,web服务器就能够获取客户端提交的信息,转交给服务器端的CGI程序进行处理,最后返回结果给客户端。
CGI脚本:简单地讲是个运行在web服务器上端程序,由浏览器端用户输入触发。
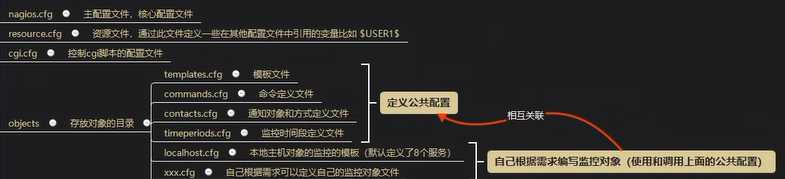
/usr/locl/nagios/etc/objects/ 子配置文件的目录
localhost.cfg 一个示例模板,默认定义了监控本机的8个服务
templates.cfg 模板定义文件
commands.cfg 命令定义文件
contacts.cfg 定义通知方式的文件
timeperiods.cfg 监控时间段定义文件
nagios主要用于监控主机资源以及服务,在nagios配置中称为对象,为了不必重复定义监控对象,Nagios引用模板配置文件,将这些共性端属性定义成模板,以便于多次引用。这就是templates.cfg的作用
在Nagios的配置过程中涉及到的几个定义有:主机、主机组,服务、服务组,联系人、联系人组,监控时间,监控命令等,从这些定义可以看出,Nagios各个配置文件之间是互为关联,彼此引用的。成功配置出一台Nagios监控系统,必须要弄清楚每个配置文件之间依赖与被依赖端关系,最重要的有四点:
1) 定义监控哪些主机、主机组、服务和服务组
2) 定义这个监控要用什么命令实现
3) 定义监控端时间段
4)定义主机或服务出现问题时要通知的联系人和联系人组
以监控本地主机为例说明:
vim /usr/local/nagios/etc/nagios.cfg

//cfg_file:指定监控对象的配置文件
# You can specify individual object config files as shown below:
cfg_file=/usr/local/nagios/etc/objects/commands.cfg
cfg_file=/usr/local/nagios/etc/objects/contacts.cfg
cfg_file=/usr/local/nagios/etc/objects/timeperiods.cfg
cfg_file=/usr/local/nagios/etc/objects/templates.cfg

# Definitions for monitoring the local (Linux) host
cfg_file=/usr/local/nagios/etc/objects/localhost.cfg

cd /usr/local/nagios/etc/objects
ll
vim localhost.cfg
# Define a host for the local machine

define host {

    use                     linux-server    调用模板,在templates.cfg里定义的
    host_name               localhost       主机名
    alias                   localhost       主机别名
    address                 127.0.0.1       被监控机器的IP
}
define hostgroup {

    hostgroup_name          linux-servers           定义一个监控主机组
    alias                   Linux Servers           别名
    members                 localhost               Linux Servers组现在只有localhost这一个成员
}
8个默认定义的服务,以监控主机是否“活着”的这一段为例
# Define a service to "ping" the local machine

define service {

    use                     local-service          使用模板,在templates.cfg里定义的
    host_name               localhost   主机名,调用的是同配置文件里define host里定义端host_name
    service_description     PING        服务描述,会在web界面显示的一个标题
    check_command           check_ping!100.0,20%!500.0,60%  检测是否活着,通过ping命令,!是分隔符
}
...前6个是私有服务
ssh和http公有服务

define service {

    use                     local-service           ; Name of service template to use
    host_name               localhost
    service_description     SSH
    check_command           check_ssh
    notifications_enabled   0
}

vim /usr/local/nagios/etc/objects/templates.cfg     模板文件
define host {

    name                            linux-server            ; The name of this host template
    use                             generic-host            ; This template inherits other values from the generic-host template
    check_period                    24x7                    ; By default, Linux hosts are checked round the clock
    check_interval                  5                       ; Actively check the host every 5 minutes   //检测时间间隔
    retry_interval                  1                       ; Schedule host check retries at 1 minute intervals     //重试时间间隔
    max_check_attempts              10                      ; Check each Linux host 10 times (max)      //最大检测次数
    check_command                   check-host-alive        ; Default command to check Linux hosts      //在commands.cfg里定义的命令
    notification_period             workhours               ; Linux admins hate to be woken up, so we only notify during the day        //通知时间在timeperiods.cfg里定义的
                                                            ; Note that the notification_period variable is being overridden from
                                                            ; the value that is inherited from the generic-host template!
    notification_interval           120                     ; Resend notifications every 2 hours        //通知间隔
    notification_options            d,u,r                   ; Only send notifications for specific host states      //通知选项
    contact_groups                  admins                  ; Notifications get sent to the admins by default       //通知组,在contacts.cfg里定义
    register                        0                       ; DON'T REGISTER THIS DEFINITION - ITS NOT A REAL HOST, JUST A TEMPLATE!    //不注册,表示这只是一个模板,被调用,不会被nagios进程认为就是一台主机
}
其中,通知选项中,w即warn,表示警告状态,u即unknown,表示不明状态;c即critical,表示紧急状态;r即recover,表示恢复状态;d即down,表示宕机状态。

vim /usr/local/nagios/etc/objects/commands.cfg
define command {

    command_name    check-host-alive
    command_line    $USER1$/check_ping -H $HOSTADDRESS$ -w 3000.0,80% -c 5000.0,100% -p 5
}

解释说明:
1.$USER1$表示resource.cfg文件中定义的插件的存放路径
2.-H 表示check_ping插件的一个产生,代表主机地址,取自于主机定义里的address域
3.$HOSTADDRESS$表示Nagios定义的一个宏,代表主机地址,取自于主机定义里端address域
4.-w、-c和-p表示check_ping插件的参数
-w,--warning=THRESHOLD,warning threshold pair
-c,--critical=THRESHOLD,critical threshold pair
-w:后面跟的是一对阀值,网络延迟平均3000ms(3s),包丢失率在80%会发出警告
-c:后面跟的是一对阀值,网络延迟平均5000ms(5s),包丢失率在100%会发出错误
-p,--packets=INTEGER    表示每次探测默认发送5个数据包
    number of ICMP ECHO packets to send (Default:5)
命令都在libexec下,用--help上查
# /usr/local/nagios/libexec/check_ping --help
延伸:对于宏端概念理解
宏(Macro),是一种批量处理的称谓。计算机科学里的宏是一种抽象(Abstraction),它根据一系列预定义端规则替换一定的文本模式。解释器或编译器在遇到宏时会自动进行这一模式替换。
Nagios中宏的理解http://nagios-cn.sourceforge.net/nagios-cn/advance.html

思路:
1)看libexec/下是否有检测ftp的命令,如果没有,网上下载,或者自己开发
2)在localhost.cfg里定义这个服务
3)在command.cfg里定义命令
步骤:
vim /usr/local/nagios/etc/objects/localhost.cfg 加上下面一段
define service {
use local-service ; Name of service template to use
host_name localhost
service_description FTP
check_command check_ftp!2!5
notifications_enabled 1
}
在/usr/local/nagios/libexec/ 下 ./check_ftp --help
vim /usr/local/nagios/etc/objects/commands.cfg
define command {
command_name check_ftp
command_line $USER1$/check_ftp -H $HOSTADDRESS$ -w $ARG1$ -c $ARG2$
}
[root@ceshi objects]# vim commands.cfg
[root@ceshi objects]# vim ../../etc/nagios.cfg
说明:
$ARG1$代表上面设置的第一个值(2s);$ARG2$ 代表上面设置的第二个值(5s)
-w:表示状态警告
-c:表示状态严重
总结:根据以上定义,当访问ftp的响应时间是2s时,nagios收集的状态为警告,当访问ftp端响应时间为5s时,nagios收集的状态为严重。
测试
[root@ceshi objects]# ../../libexec/check_ftp -H localhost -w 2 -c 5
connect to address localhost and port 21: Connection refused
[root@ceshi objects]# service nagios restart
Running configuration check... Stopping nagios: done.
Starting nagios: Running configuration check... done.
[root@ceshi objects]# service vsftpd start
Starting vsftpd for vsftpd: [ OK ]
[root@ceshi objects]# ../../libexec/check_ftp -H localhost -w 2 -c 5
FTP OK - 0.007 second response time on localhost port 21 [220 (vsFTPd 2.2.2)]|time=0.006735s;2.000000;5.000000;0.000000;10.000000
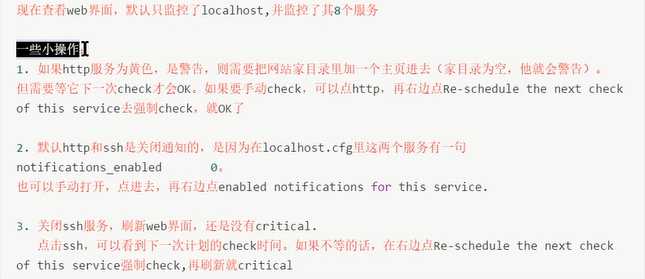
手动调度一下,出现绿色ok


如果本机的ftp服务默认端口不是21,而是2121,该如何监控?
思路:
1.更改ftp的默认端口为2121
2.在监控主机端配置文件localhost.cfg文件里加上监控命令
3.如果命令没有在commands.cfg,就需要自己写
vim /etc/vsftpd/vsftpd.conf
listen_port=2121 --加上这一句
/etc/init.d/vsftpd restart
netstat -ntlup |grep ftp
[root@ceshi objects]# vim /etc/vsftpd/vsftpd.conf
[root@ceshi objects]# service vsftpd restart
Shutting down vsftpd: [ OK ]
Starting vsftpd for vsftpd: [ OK ]
[root@ceshi objects]# netstat -nltup|grep vsftpd
tcp 0 0 0.0.0.0:2121 0.0.0.0:* LISTEN 31853/vsftpd
[root@ceshi objects]# vim localhost.cfg
check_command check_ftp!2!5!2121
[root@ceshi objects]# vim commands.cfg
define command {
command_name check_ftp
command_line $USER1$/check_ftp -H $HOSTADDRESS$ -w $ARG1$ -c $ARG2$ -p $ARG3$
}
重启nagios服务
service nagios restart
测试验证
[root@ceshi objects]# ../../libexec/check_ftp -H localhost -w 2 -c 5 -p 2121
FTP OK - 0.002 second response time on localhost port 2121 [220 (vsFTPd 2.2.2)]|time=0.001923s;2.000000;5.000000;0.000000;10.000000
如下图,端口已经变为2121
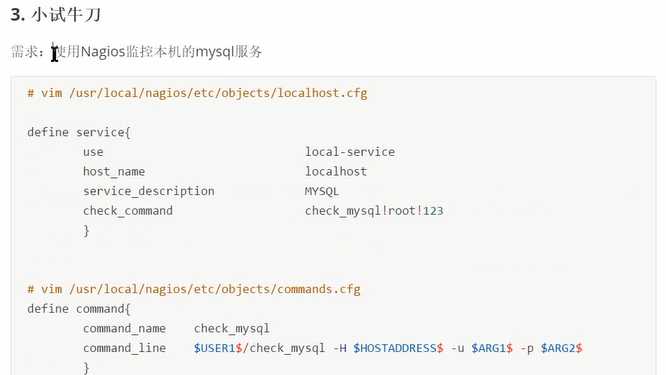
需求:监控远程服务器10.1.1.2和10.1.1.3是否存活,并且再监控10.1.1.3上的http服务
思路:
示例:
vim /usr/local/nagios/etc/objects/remote.cfg
//先定义需要监控端对象主机
define host{
        use     linux-werver
    host_name   10.1.1.2    //主机名,最好/etc/hosts里对应的IP
        alias   10.1.1.2    //显示到web上的名字
        address 10.1.1.2    //实际监控的主机IP
        }
1.vim /usr/local/nagios/etc/objects/remote.cfg
define host {
use linux-server
host_name 10.1.1.5
alias 10.1.1.5
address 10.1.1.5
}
define hostgroup {
hostgroup_name remote linux-servers
alias remote Linux Servers
members 10.1.1.5
}
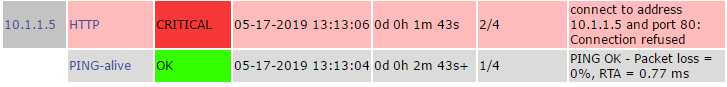
define service {
use local-service
hostgroup_name remote linux-servers
service_description PING-alive
check_command check_ping!100.0,20%!500.0,60%
}
define service {
use local-service
host_name 10.1.1.5
service_description HTTP
check_command check_http
}
2.[root@nagios-server objects]# vim /usr/local/nagios/etc/nagios.cfg
cfg_file=/usr/local/nagios/etc/objects/remote.cfg
命令里有http和ping的
3.测试验证
先启动httpd服务
[root@nagios-server objects]# service nagios restart
Running configuration check... Stopping nagios: No lock file found in /var/run/nagios.lock
Starting nagios: Running configuration check... done.
[root@nagios-server objects]# ../../libexec/check_ping -H 10.1.1.5 -w 1000,20% -c 2000,50%
PING OK - Packet loss = 0%, RTA = 0.70 ms|rta=0.698000ms;1000.000000;2000.000000;0.000000 pl=0%;20;50;0
在被监控的主机上开启HTTP服务
[root@lamp ~]# /usr/local/apache2/bin/apachectl start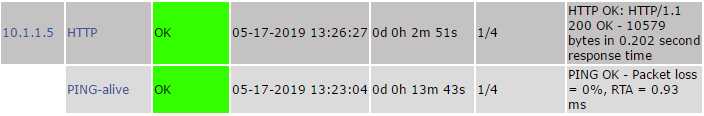
[root@nagios-server nagios]# tar -xf nrpe-2.15.tar.gz -C /usr/src/
[root@nagios-server nagios]# cd /usr/src/nrpe-2.15
[root@nagios-server nrpe-2.15]# ./configure
[root@nagios-server nrpe-2.15]# make
[root@nagios-server nrpe-2.15]# make install

NRPE port:    5666

//可以查看check_nrpe命令说明安装成功
ls /usr/local/nagios/libexec/check_nrpe
define command {
    command_name    check_nrpe
    command_line    $USER1$/check_nrpe -H $HOSTADDRESS$ -c $ARG1$
}
说明:
-c参数后接command,也就是数check_nrpe 可以调用别的check命令
说明:
1.你可以重新编写一个xxx.cfg文件,也可以直接放到上面创建的remote.cfg文件里
2.下面定义的命令比如check_remote_root,是被监控主机上的命令,监控机可以调用它。
vim /usr/local/nagios/etc/objects/remote.cfg
define service {
    use                     local-service
    host_name               10.1.1.5
    service_description     Root Partition
    check_command           check_nrpe!check_remote_root
}

define service {
    use                     local-service
    host_name               10.1.1.5
    service_description     Current Users
    check_command           check_nrpe!check_remote_users
}

define service {
    use                     local-service
    host_name               10.1.1.5
    service_description     Total Processes
    check_command           check_nrpe!check_total_procs
}

define service {
    use                     local-service
    host_name               10.1.1.5
    service_description     Current Load
    check_command           check_nrpe!check_remote_load
}

define service {
    use                     local-service
    host_name               10.1.1.5
    service_description     Swap Usage
    check_command           check_nrpe!check_remote_swap
}

检测配置文件是否正确:
/usr/local/nagios/bin/nagios -v /usr/local/nagios/etc/nagios.cfg
准备软件包
[root@lamp nagios]# ls
nagios-plugins-2.2.1.tar.gz  nrpe-2.15.tar.gz

1.新建用户
[root@lamp nagios]# useradd nagios
[root@lamp nagios]# groupadd nagiosgroup
[root@lamp nagios]# usermod -G nagiosgroup nagios

2.安装plugins插件,包含数据采集命令脚本
tar -xf nagios-plugins-2.2.1.tar.gz -C /usr/src/
cd /usr/src/nagios-plugins-2.2.1/
./configure --with-nagios-user=nagios --with-nagios-group=nagiosgroup
make && make install

3.安装nrpe
注意:配置过程中可能出现如下错误
checking for SSL headers... configure: error: Cannot find ssl headers
原因:缺少openssl-devel软件包
解决:安装它  yum -y install openssl-devel

tar xf nrpe-2.15.tar.gz -C /usr/src
cd /usr/src/nrpe-2.15/
./configure && make && make install
yum -y install openssl-devel
./configure && make && make install
make install-plugin
make install-daemon
make install-daemon-config
make install-xinetd

4.修改nrpe的超级守护进程的配置文件
vim /etc/xinetd.d/nrpe
service nrpe
{
        flags           = REUSE
        socket_type     = stream
        port            = 5666
        wait            = no
        user            = nagios
        group           = nagios
        server          = /usr/local/nagios/bin/nrpe
        server_args     = -c /usr/local/nagios/etc/nrpe.cfg --inetd
        log_on_failure  += USERID
        disable         = no
        only_from       = 127.0.0.1 192.168.75.136  //增加监控端主机IP
}

vim /etc/services   //最后面加一行
nrpe    5666/tcp    # NRPE

5.在nrpe配置文件里定义check命令,使nagios服务能调用

vim /usr/local/nagios/etc/nrpe.cfg
command[check_remote_users]=/usr/local/nagios/libexec/check_users -w 5 -c 10
command[check_remote_load]=/usr/local/nagios/libexec/check_load -w 15,10,5 -c 30,25,20
command[check_remote_root]=/usr/local/nagios/libexec/check_disk -w 20% -c 10% -p /
command[check_remote_total_procs]=/usr/local/nagios/libexec/check_procs -w 150 -c 200
command[check_remote_swap]=/usr/local/nagios/libexec/check_swap -w 40%% -c 20%%

下面这个是默认有的,但nagios服务器那边没加,这个在这里没有用(僵尸进程)
command[check_zombie_procs]=/usr/local/nagios/libexec/check_procs -w 5 -c 10 -s Z

6.安装xinetd服务
yum -y install xinetd
service xinetd start
[root@lamp nrpe-2.15]# netstat -nltp|grep xinetd
tcp        0      0 :::5666                     :::*                        LISTEN      29000/xinetd

7.在本地或nagios服务器测试
在被监控端测试成功
/usr/local/nagios/libexec/check_users -w 5 -c 10

[root@lamp nrpe-2.15]# /usr/local/nagios/libexec/check_users -w 5 -c 10
USERS OK - 2 users currently logged in |users=2;5;10;0

在nagios服务器上测试成功
/usr/local/nagios/libexec/check_nrpe -H 10.1.1.5 -c check_remote_users

8.回到nagios服务器重启服务
/etc/init.d/nagios restart

1.测试当前服务器是否可以发送邮件
ping www.baidu.com
echo test nagios |mail -s 'nagios' 1206xxx4@qq.com
2.定义指定的收件人
vim /usr/local/nagios/etc/objects/contacts.cfg
define contact {
    contact_name        nagiosadmin
    use                 generic-contact
    alias               Nagios  Admin
    email               xxxxx@qq.com
}
3.测试验证
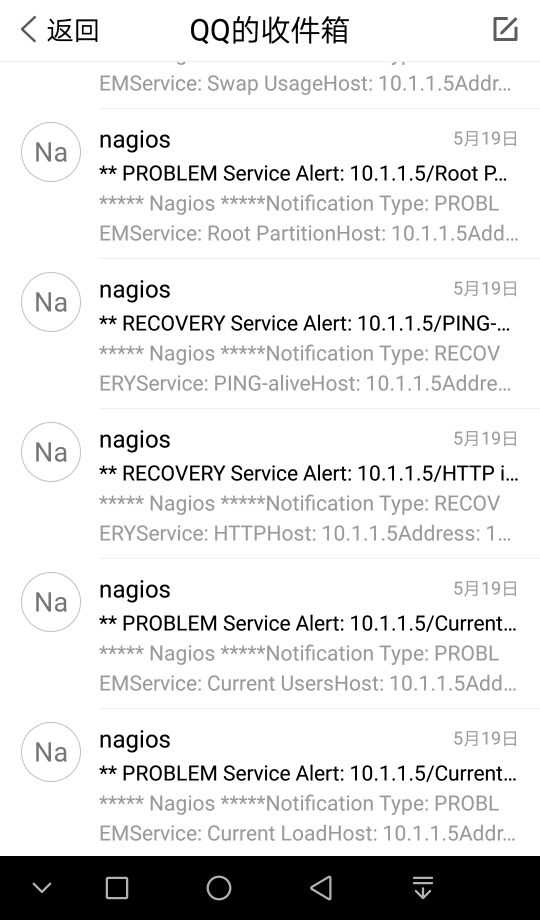
把几个服务关闭,再重启,等邮件通知。本人qq,亲测有效。
标签:sock rsh lamp环境 processes wap 方便 本地 hat sql
原文地址:https://www.cnblogs.com/liuwei-xd/p/11022795.html