标签:比较 nts environ htm string vat add div 接受
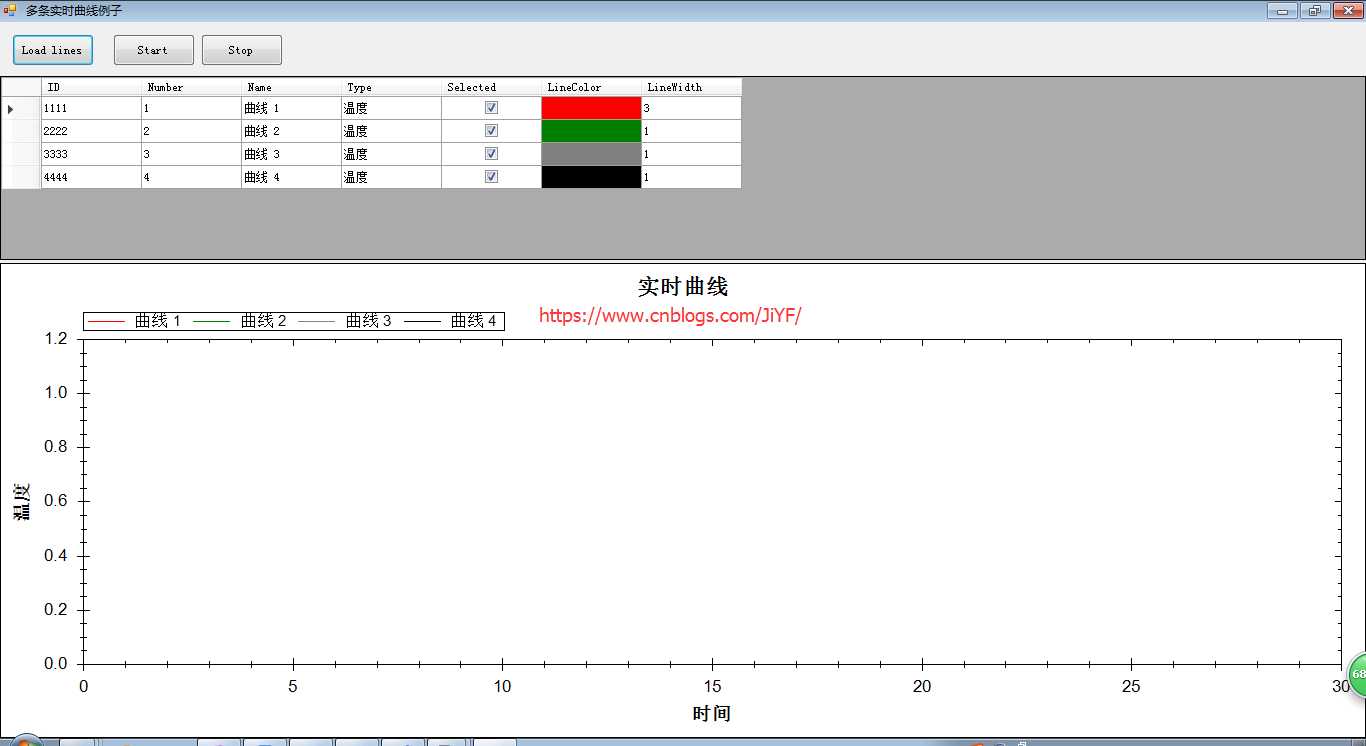
先看展示效果

 1 public class LineChannel
 2     {
 3         public LineChannel(int id,int number,string name,string type,bool selected,Color lineColor,int lineWidth)
 4         {
 5             this.id = id;
 6             this.number = number;
 7             this.name = name;
 8             this.type = type;
 9             this.selected = selected;
10             this.lineColor = lineColor;
11             this.lineWidth = lineWidth;
12         }
13
14         private int id;
15         private int number;
16         private string name;
17         private string type;
18         private bool selected;
19         private Color lineColor;
20         private int lineWidth;
21
22
23         public int ID
24         {
25             get { return this.id; }
26             //set { this.id = value; }
27         }
28
29         public int Number
30         {
31             get { return this.number; }
32         }
33
34         public string Name
35         {
36             get { return this.name; }
37             //set { this.name = value; }
38         }
39
40         public string Type
41         {
42             get { return this.type; }
43             //set { this.type = value; }
44         }
45         public bool Selected
46         {
47             get { return this.selected; }
48             set { this.selected = value; }
49         }
50         public Color LineColor
51         {
52             get { return this.lineColor; }
53             set { this.lineColor = value; }
54         }
55         public int LineWidth
56         {
57             get { return this.lineWidth; }
58             set { this.lineWidth = value; }
59         }
60
61     }
 1   //加载创建曲线数据
 2             LineChannel lineChannel1 = new LineChannel(1111, 1, "曲线 1", "温度", true, Color.Red, 1);
 3             LineChannel lineChannel2 = new LineChannel(2222, 2, "曲线 2", "温度", true, Color.Green, 1);
 4             LineChannel lineChannel3 = new LineChannel(3333, 3, "曲线 3", "温度", true, Color.Gray, 1);
 5             LineChannel lineChannel4 = new LineChannel(4444, 4, "曲线 4", "温度", true, Color.Black, 1);
 6
 7             this.lines.Add(lineChannel1);
 8             this.lines.Add(lineChannel2);
 9             this.lines.Add(lineChannel3);
10             this.lines.Add(lineChannel4);
11
12
13             //获取引用
14             GraphPane myPane = zedGraphControl1.GraphPane;
15             //设置标题
16             myPane.Title.Text = "实时曲线";
17             //设置X轴说明文字
18             myPane.XAxis.Title.Text = "时间";
19             //设置Y轴说明文字
20             myPane.YAxis.Title.Text = "温度";
21
22
23             //添加曲线
24             foreach (LineChannel channel in this.lines)
25             {
26                 RollingPointPairList list = new RollingPointPairList(1200);
27                 LineItem curve = myPane.AddCurve(channel.Name, list, channel.LineColor, SymbolType.None);
28             }
29
30
31             int increment = 30;//单位s
32
33
34
35
36             myPane.XAxis.Scale.Min = 0; //X轴最小值0
37             myPane.XAxis.Scale.Max = 30; //X轴最大30
38             myPane.XAxis.Scale.MinorStep = 1;//X轴小步长1,也就是小间隔
39             myPane.XAxis.Scale.MajorStep = 5;//X轴大步长为5,也就是显示文字的大间隔
40
41             //改变轴的刻度
42             zedGraphControl1.AxisChange();
43             this.zedGraphControl1.Invalidate();
44             this.dataGridViewLines.DataSource = this.lines;
45             this.dataGridViewLines.ClearSelection();
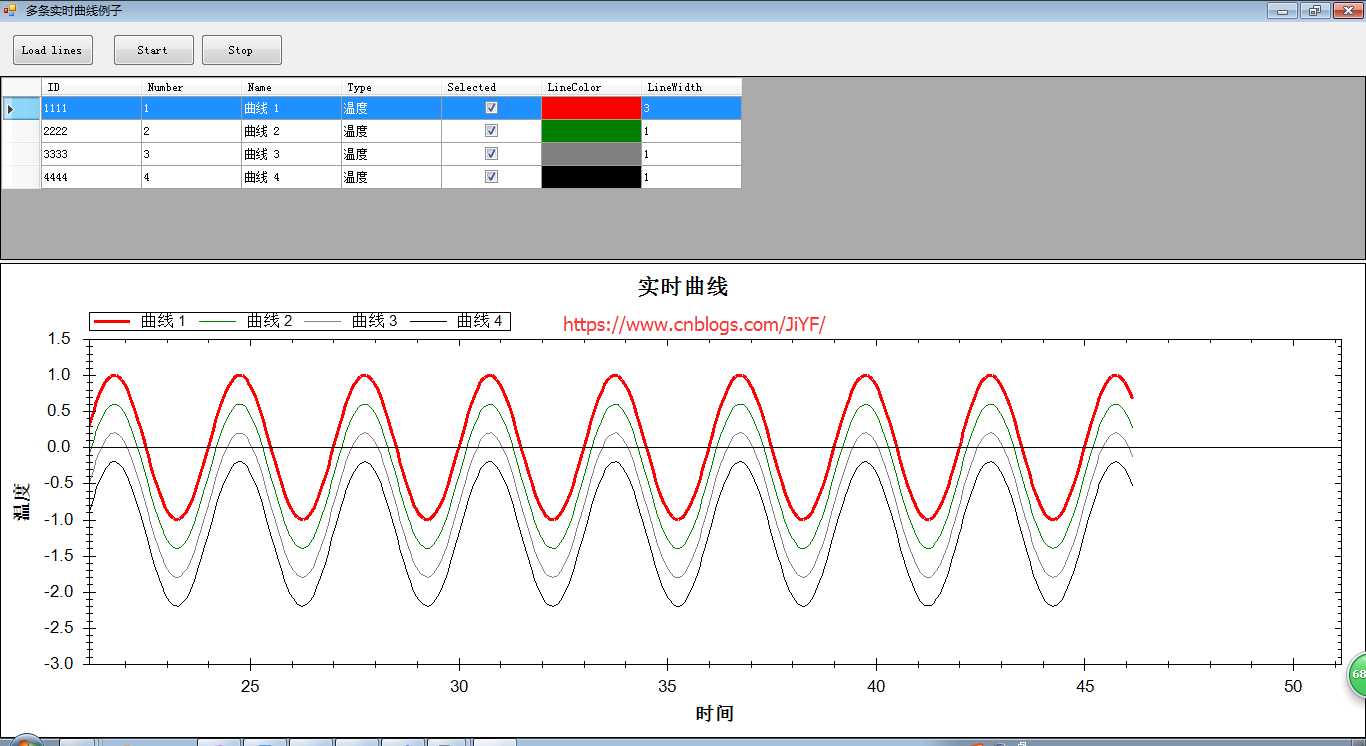
 1   //保存开始时间
 2             tickStart = Environment.TickCount;
 3             stop = false;
 4             BackgroundWorker worker = sender as BackgroundWorker;
 5
 6             isSampling = true;
 7             List<LineChannel> channels = this.lines;
 8             //DoWork
 9             LineData lineData;
10             while (isSampling)
11             {
12                 lineData = new LineData();
13
14
15                 //获取数据
16                 double time = (Environment.TickCount - tickStart) / 1000.0;
17                 double data = Math.Sin(2.0 * Math.PI * time / 3.0);
18                 double data2 = data - 0.4;
19                 double data3 = data - 0.8;
20                 double data4 = data - 1.2;
21
22                 //添加数据
23                 lineData.Add(channels[0], time, data);
24                 lineData.Add(channels[1], time, data2);
25                 lineData.Add(channels[2], time, data3);
26                 lineData.Add(channels[3], time, data4);
27
28                 //上报数据处理
29                 worker.ReportProgress(0, lineData);
30
31                 Thread.Sleep(50);
32             }
 1 LineData lineData = e.Data;
 2
 3             double time = 0, data = 0;
 4
 5             foreach (LineChannel channel in lineData.Channels)
 6             {
 7                 if (e.Data.GetData(channel, out time, out data))
 8                 {
 9                     LineItem curve = null;
10
11                     foreach (var item in zedGraphControl1.GraphPane.CurveList)
12                     {
13                         if (item.Label.Text == channel.Name)
14                             curve = item as LineItem;
15                     }
16
17                     if (curve != null)
18                     {
19                         IPointListEdit list = curve.Points as IPointListEdit;
20                         list.Add(time, data);
21                     }
22
23                     curve.IsVisible = channel.Selected;
24                     curve.Line.Width = channel.LineWidth;
25                     curve.Line.Color = channel.LineColor;
26
27
28                 }
29
30
31             }
32
33
34             Scale xScale = zedGraphControl1.GraphPane.XAxis.Scale;
35             if (time > xScale.Max - xScale.MajorStep)
36             {
37                 xScale.Max = time + xScale.MajorStep;
38                 xScale.Min = xScale.Max - 30.0;
39             }
40
41
42             //if (time > xScale.Max)
43             //{
44             //    xScale.Max = time;
45             //    xScale.Min = xScale.Max - 30;
46             //}
47
48
49             //第三步:调用ZedGraphControl.AxisChange()方法更新X和Y轴的范围
50             zedGraphControl1.AxisChange();
51
52             //第四步:调用Form.Invalidate()方法更新图表
53             zedGraphControl1.Invalidate();
初始化曲线
开始采集
实现了比较基础简单的功能,提供思路,遇到bug不要惊讶,没有细调,需要源代码可以留言,给出邮箱,看到后会回复。
本程序参考
https://www.cnblogs.com/chuhj/p/7988404.html
标签:比较 nts environ htm string vat add div 接受
原文地址:https://www.cnblogs.com/JiYF/p/11182658.html