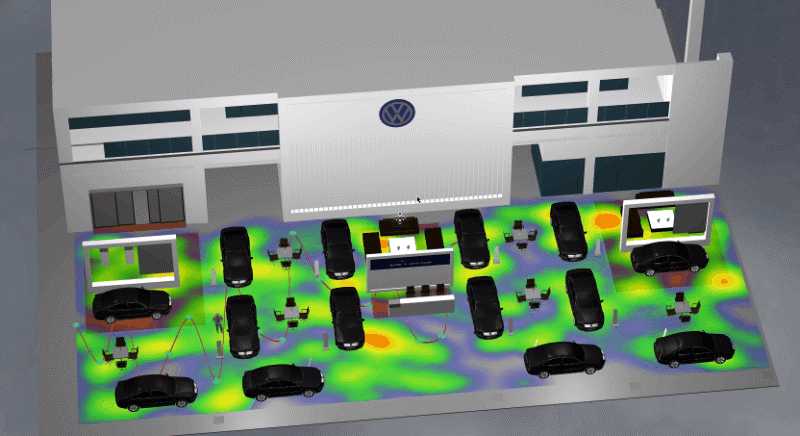
标签:creat code 绿色 ima 画圆 point upd ota 渐变

1.热力图
开始的时候,是用一个网上找的canvas画渐变热点的demo,原理就是给定顶点坐标,然后画圆,颜色使用渐变色,根据权重决定渐变的层数(红色->橙色->绿色) 。
但是终究觉得这种方法不仅繁琐,而且画出来的效果不够自然。
后来发现有一个开源库heatmap效果很好,它是这样用的(官方demo地址链接):
var heatmapInstance = h337.create({
    container: document.querySelector(‘.heatmap‘)
});
var data = {
    max: max,
    data: points
};
heatmapInstance.setData(data);
max值为所有points中权重属性的最大值。
看到这里,那我们要怎么在three.js中去使用heatmap呢,他是用dom去实例化heatmap对象的啊。
不用担心,我们可以creatElement(‘div‘),然后在这个dom对象上实例化heatmap对象,并且
var canvas = heatmapdiv.getElementsByTagName(‘canvas‘)[0];
获取绘制后的canvas对象。
        let heatMapGeo = new THREE.PlaneGeometry(120,90);
        let heatMapTexture = new THREE.Texture(canvas);
        let heatMapMaterial = new THREE.MeshBasicMaterial({
            map: heatMapTexture,
            transparent:true
        });
        heatMapMaterial.map.needsUpdate = true;
        var heatMapPlane = new THREE.Mesh(heatMapGeo,heatMapMaterial);
        heatMapPlane.position.set(0,0.1,0);
        heatMapPlane.rotation.x = -Math.PI/2;
        this.scene.add(heatMapPlane);
这样,用heatmap绘制的热力图就添加到了three.js创建的场景中去了。
2.轨迹线
标签:creat code 绿色 ima 画圆 point upd ota 渐变
原文地址:https://www.cnblogs.com/eco-just/p/11667985.html