标签:style blog http ar for sp 2014 log cti
fitbit <- read.csv("fitbit.csv")
date cal step dist floor sit inactive walk run
1 2014年1月1日 2496 12803 9.14 15 1161 123 98 58
2 2014年1月2日 2513 12955 9.47 12 1188 112 67 73
3 2014年1月3日 2228 8768 6.31 16 1234 97 72 37
4 2014年1月4日 2336 8971 6.41 16 1140 174 113 13
5 2014年1月5日 2508 12078 9.05 8 1153 130 108 49
6 2014年1月6日 2763 15880 11.36 20 1061 177 141 61
7 2014年1月7日 2453 10895 7.78 12 1145 156 99 40
8 2014年1月8日 2449 11692 8.44 13 1164 121 118 37
attach(fitbit) #可以直接用step表示fitbit$step了
plot(step, dist)
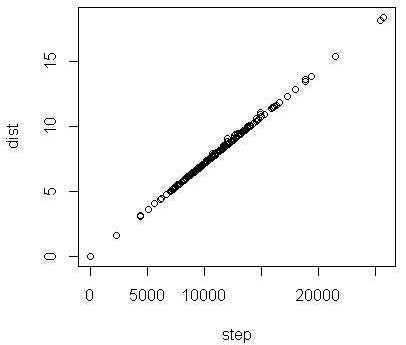
查看step与dist的相关度,可以看出值几乎等于1,说明步数与距离是强相关。
cor(step, dist)
[1] 0.9998078
进行简单的线性回归:
dist.step <- lm(dist ~ step, fitbit)
显示dist.step的值可以看到:
Call: lm(formula = dist ~ step, data = fitbit)
Coefficients:
(Intercept) step
-0.0059966 0.0007171
说明拟合的公式为:dist = -0.0059966 + 0.0007171 * step
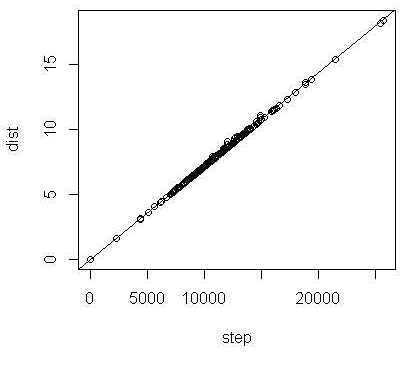
可以用abline函数画出拟合的直线:
abline(dist.step)
还有一个更牛的car包,可以一次性绘出更强的图形:
library(car)
scatterplot(dist ~ step, data = fitbit)
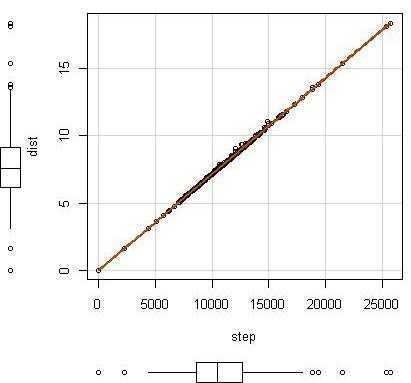
在坐标系的旁边还有箱线图,图中自动画出了拟合的直线。
可以看看卡路里消耗与步数的关系:
scatterplot(cal ~ step, data = fitbit, spread=FALSE)
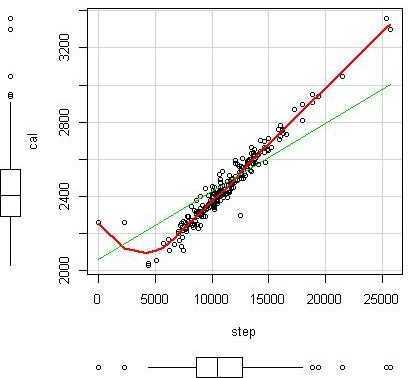
可以看出这函数自动拟合了一条直线和一条曲线。
标签:style blog http ar for sp 2014 log cti
原文地址:http://www.cnblogs.com/speeding/p/4063705.html