标签:log div mit add 图片 底部 weight http width
from matplotlib.patches import Ellipse, Circle
import matplotlib.pyplot as plt

fig = plt.figure()
ax = fig.add_subplot(111)

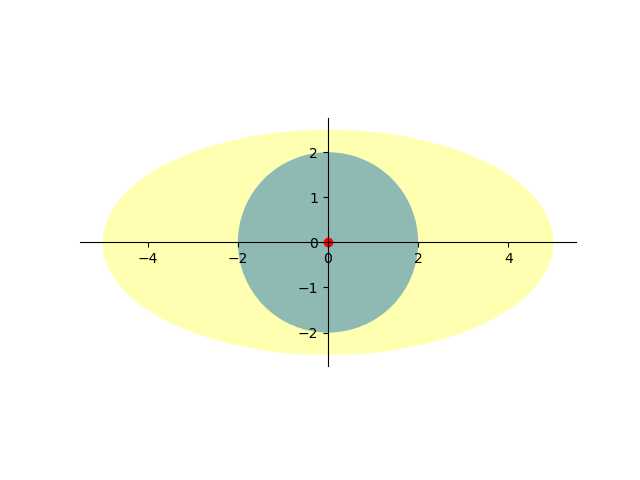
ell1 = Ellipse(xy = (0.0, 0.0), width = 10, height = 5, angle = 0.0, facecolor= ‘yellow‘, alpha=0.3)
cir1 = Circle(xy = (0.0, 0.0), radius=2, alpha=0.5)
ax.add_patch(ell1)
ax.add_patch(cir1)

x, y = 0, 0
ax.plot(x, y, ‘ro‘)

plt.axis(‘scaled‘)
ax.spines[‘right‘].set_color(‘none‘)  # 设置右‘脊梁’为无色
ax.spines[‘top‘].set_color(‘none‘)  # 设置上‘脊梁’为无色
ax.xaxis.set_ticks_position(‘bottom‘)  # 底部‘脊梁’设置为X轴
ax.spines[‘bottom‘].set_position((‘data‘, 0))  # 底部‘脊梁’移动位置,y的data
ax.yaxis.set_ticks_position(‘left‘)  # 左部‘脊梁’设置为Y轴
ax.spines[‘left‘].set_position((‘data‘, 0))  # 左部‘脊梁’移动位置,x的data
plt.savefig(‘d:/test2.png‘)

#plt.axis(‘equal‘)   #changes limits of x or y axis so that equal increments of x and y have the same length

plt.show()

来自:https://www.cnblogs.com/yibeimingyue/p/9916048.html
from matplotlib.patches import Ellipse, Circle
import matplotlib.pyplot as plt

fig = plt.figure()
ax = fig.add_subplot(111)

ell1 = Ellipse(xy = (0.0, 0.0), width = 10, height = 5, angle = 0.0, facecolor= ‘yellow‘, alpha=0.3)
cir1 = Circle(xy = (0.0, 0.0), radius=2, alpha=0.5)
ax.add_patch(ell1)
ax.add_patch(cir1)

x, y = 0, 0
ax.plot(x, y, ‘ro‘)

plt.axis(‘scaled‘)
ax.spines[‘right‘].set_color(‘none‘)  # 设置右‘脊梁’为无色
ax.spines[‘top‘].set_color(‘none‘)  # 设置上‘脊梁’为无色
ax.xaxis.set_ticks_position(‘bottom‘)  # 底部‘脊梁’设置为X轴
ax.spines[‘bottom‘].set_position((‘data‘, 0))  # 底部‘脊梁’移动位置,y的data
ax.yaxis.set_ticks_position(‘left‘)  # 左部‘脊梁’设置为Y轴
ax.spines[‘left‘].set_position((‘data‘, 0))  # 左部‘脊梁’移动位置,x的data
plt.savefig(‘d:/test2.png‘)

#plt.axis(‘equal‘)   #changes limits of x or y axis so that equal increments of x and y have the same length

plt.show()
标签:log div mit add 图片 底部 weight http width
原文地址:https://www.cnblogs.com/gisoracle/p/12024936.html