标签:data oat int sum 可靠性 art frame 发动机 日期
Python高级应用程序设计任务要求
用Python实现一个面向主题的网络爬虫程序,并完成以下内容:
(注:每人一题,主题内容自选,所有设计内容与源代码需提交到博客园平台)
一、主题式网络爬虫设计方案(15分)
1.主题式网络爬虫名称
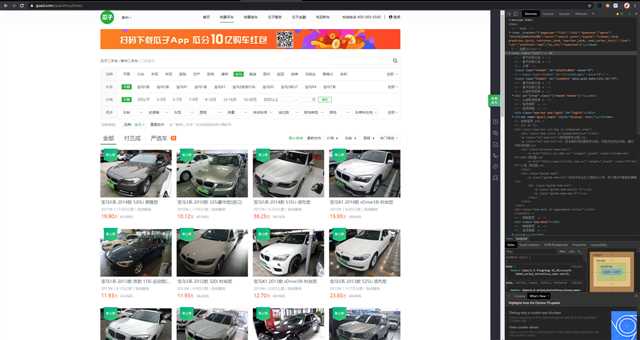
瓜子二手车网站数据爬取
2.主题式网络爬虫爬取的内容与数据特征分析
品牌、车型、年月、公里数、售价
爬取内容:基本参数、发动机参数、底盘及制动、安全配置、外部配置、内部配置
3.主题式网络爬虫设计方案概述(包括实现思路与技术难点)
爬取瓜子二手车数据实现思路:使用requests库爬取数据、生成所有需要抓取的URL,对所有目标链接进行数据抓取,存储数据
爬取瓜子二手车数据技术难点:瓜子二手车网运用的反爬虫措施主要有js混淆,根据发送的原始header和js混淆生成特定的cookie才能访问到网站。
deal_head.py处理的数js混淆和生成特定的header。原始header的user-agent必须是使用电脑相同的平台(windows、linux),不一致返回不了有效的cookie。
二、主题页面的结构特征分析(15分)
1.主题页面的结构特征
2.Htmls页面解析
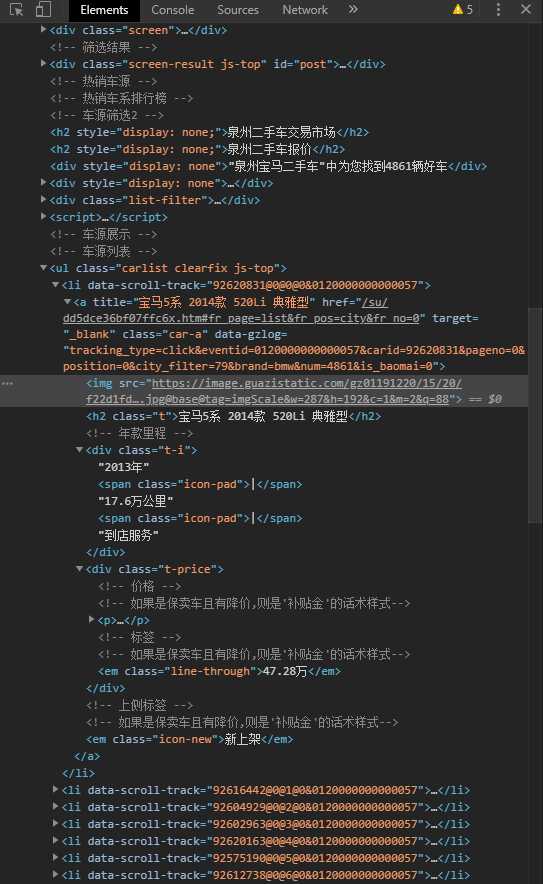
主题页面为瓜子二手车网站宝马检索结果的HTML代码,需要的信息保存在carlist选择器属性的标签中
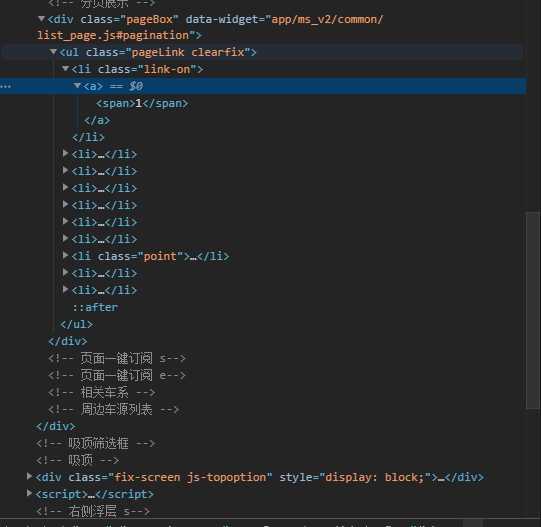
页数内容在该结构中,以此分析如何按页爬取所需要的数据
3.节点(标签)查找方法与遍历方法
(必要时画出节点树结构)
<html>→<ul class="carlist">→<li class="data">
三、网络爬虫程序设计(60分)
爬虫程序主体要包括以下各部分,要附源代码及较详细注释,并在每部分程序后面提供输出结果的截图。
1.数据爬取与采集
# 导入第三方包
import requests
from bs4 import BeautifulSoup
import time

# 设置伪头
headers = {
    ‘Accept‘:‘*/*‘,
    ‘Accept-Encoding‘:‘gzip, deflate, br‘,
    ‘Accept-Language‘:‘zh-CN,zh;q=0.8‘,
    ‘Connection‘:‘keep-alive‘,
    ‘User-Agent‘:‘Mozilla/5.0 (Windows NT 6.1; WOW64) AppleWebKit/537.36 (KHTML, like Gecko) Chrome/61.0.3163.79 Safari/537.36‘
}
# 二手车主页的链接
url = ‘https://www.guazi.com/quanzhou/bmw/‘
# 发出抓取链接的请求并进一步解析
res = requests.get(url, headers = headers).text
soup = BeautifulSoup(res,‘html.parser‘)
# 抓取二手车品牌名称及对应的链接
car_brands = soup.findAll(‘div‘,{‘class‘:‘brand-name‘})
car_brands = [j for i in car_brands for j in i]
brands = [i.text for i in car_brands]
urls = [‘https://www.guazi.com/quanzhou/bmw/‘ + i[‘href‘] for i in car_brands]
# 生成所需抓取的目标链接
target_urls = []
target_brands = []
for b,u in zip(brands,urls):
    # 抓取各品牌二手车主页下的所有页码
    res = requests.get(u, headers = headers).text
    soup = BeautifulSoup(res,‘html.parser‘)
    # 查询出页数
    if len(soup.findAll(‘div‘,{‘class‘:‘the-pages‘})) == 0:
        pages = 1
    else:
        pages = int([page.text for page in soup.findAll(‘div‘,{‘class‘:‘the-pages‘})[0].findAll(‘a‘)][-2])
    time.sleep(3)

    for i in range(1,pages + 1):
        target_brands.append(b)
        target_urls.append(u+‘?page=‘+str(i)+‘#pagetag‘)
# 构建空列表,用于数据的存储
brand = []
title = []
boarding_time = []
km = []
discharge = []
sec_price = []
new_price = []
# 对每个链接发生请求
for b,u in zip(target_brands,target_urls):

    res = requests.get(u, headers = headers).text
    soup = BeautifulSoup(res,‘html.parser‘)

    # 每页车子的数量
    N = len([i.findAll(‘a‘)[0][‘title‘] for i in soup.findAll(‘div‘,{‘class‘:‘item_details‘})])
    try:
        # 车品牌
        brands = (b+‘-‘)*N
        brand.extend(brands.split(‘-‘)[:-1])
        # 车名称
        title.extend([i.findAll(‘a‘)[0][‘title‘] for i in soup.findAll(‘div‘,{‘class‘:‘item_details‘})])
        # 二手车的上牌时间、行驶里程数等信息
        info = [i.findAll(‘li‘) for i in soup.findAll(‘ul‘,{‘class‘:‘ul_news‘})]
        boarding_time.extend([i[0].text[4:] for i in info])
        km.extend([i[1].text[4:] for i in info])
        discharge.extend([i[3].text[4:] for i in info])
        sec_price.extend([float(i.findAll(‘h2‘)[0].text[:-1]) for i in soup.findAll(‘div‘,{‘class‘:‘item_price‘})])
        new_price.extend([i.findAll(‘p‘)[0].text.split(‘\xa0‘)[0][5:].strip() for i in soup.findAll(‘div‘,{‘class‘:‘item_price‘})])

    except IndexError:
        pass
    # 每4秒停顿一次
    time.sleep(4)
# 数据导出
import pandas as pd
cars_info = pd.DataFrame([brand,title,boarding_time,km,discharge,sec_price,new_price]).T
cars_info = cars_info.rename(columns={0:‘Brand‘,1:‘Name‘,2:‘Boarding_time‘,3:‘Km‘,4:‘Discharge‘,5:‘Sec_price‘,6:‘New_price‘})
cars_info.to_csv(‘second_cars_info.csv‘, index=False)
2.对数据进行清洗和处理
# 导入第三方模块
import pandas as pd
import numpy as np
import matplotlib.pyplot as plt
from nbconvert.exporters import python
from sklearn.linear_model import LinearRegression
# 可视化的中文处理
plt.rcParams[‘font.sans-serif‘] = ‘Microsoft YaHei‘
plt.rcParams[‘axes.unicode_minus‘] = False
# 设置风格
plt.style.use(‘ggplot‘)
# 读取数据
cars = pd.read_csv(‘second_cars_info.csv‘, encoding=‘utf-8‘)
# 取出上牌时间变量中的年和月
cars[‘year‘] = cars.Boarding_time.str[:4].astype(‘int‘)
month = cars.Boarding_time.str.findall(‘年(.*?)月‘)
# print(month.head(10))
# 由于month是列表构成的序列,所以需要非列表化,再序列化
month = pd.Series([i[0] for i in month]).astype(‘int‘)
cars[‘month‘] = month
# print(month.head(10))
# 计算上牌日期距离2017年10月份的月数
cars[‘diff_months‘] = (2017 - cars.year) * 12 + (10 - cars.month) + 1
# 显示数据的前5行
cars.head(5)
# 剔除“万公里”三个字
cars[‘Km_new‘] = cars.Km.str[:-3]
# 数值类型转换
cars.Km_new = cars.Km_new.astype(‘float‘)
# “百公里内”的样本量
N = np.sum(cars.Km == ‘百公里内‘)
Ratio = N / cars.shape[0]
# 将“百”字替换为0.005
cars.Km_new.replace(‘百‘, ‘0.005‘, inplace=True)
# 数据类型转换
cars.Km_new = cars.Km_new.astype(‘float‘)
cars.head()
# 删除字段中的“万”字
cars[‘New_price_new‘] = cars.New_price.str[:-1]
# “暂无”的样本量
N = np.sum(cars.New_price == ‘暂无‘)
Ratio = N / cars.shape[0]
cars = cars.loc[cars.New_price != ‘暂无‘, :]
# 数据类型的转换
cars.New_price_new = cars.New_price_new.astype(‘float‘)
cars.head()
# 数据集的概览信息
cars.describe()
3.文本分析(可选):jieba分词、wordcloud可视化
4.数据分析与可视化
(例如:数据柱形图、直方图、散点图、盒图、分布图、数据回归分析等)
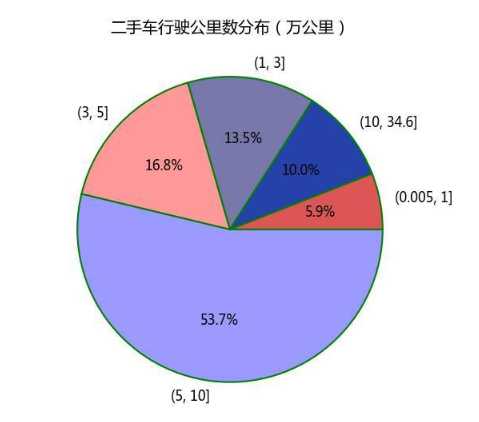
# 行驶公里数饼状图
km_min = cars.Km_new.min()
km_max = cars.Km_new.max()
# 切割数据片段
km_cuts = pd.cut(cars.Km_new, bins=[km_min, 1, 3, 5, 10, km_max])
km_stats = km_cuts.value_counts()
km_stats
# 绘制饼图
# 将横、纵坐标轴标准化处理
plt.axes(aspect=‘equal‘)
# 提取出索引作为标签
labels = km_stats.index
# 自定义颜色
colors = [‘#9999ff‘, ‘#ff9999‘, ‘#7777aa‘, ‘#2442aa‘, ‘#dd5555‘]
# 绘制饼图
plt.pie(km_stats.values,
        labels=labels,
        colors=colors,  # 设置颜色
        autopct=‘%.1f%%‘,  # 设置百分比的格式,这里保留一位小数
        counterclock=False,  # 设置为顺时针方向显示图形
        wedgeprops={‘linewidth‘: 1.5, ‘edgecolor‘: ‘green‘},  # 设置饼图内外边界的属性值
        textprops={‘fontsize‘: 12, ‘color‘: ‘k‘}  # 设置文本标签的属性值
        )
# 添加图标题
plt.title(‘二手车行驶公里数分布(万公里)‘)
# 显示图形
plt.show()
5.数据持久化
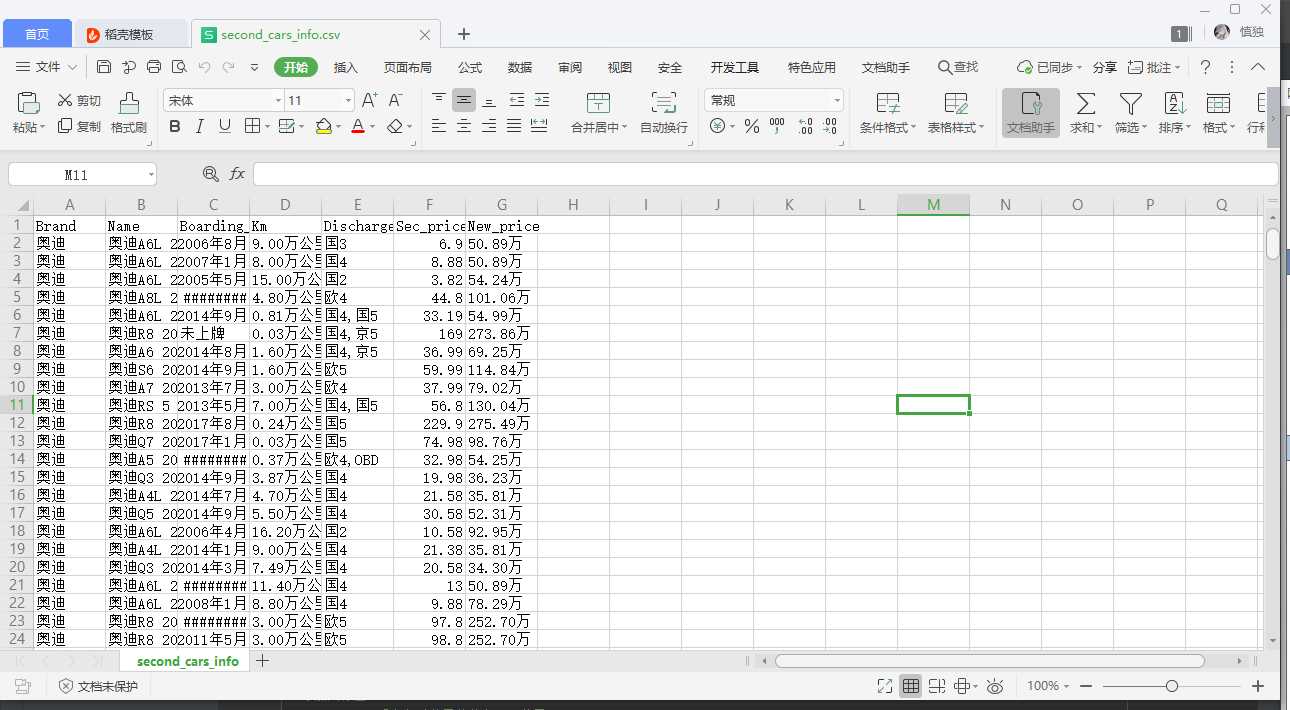
数据导出为CSV文件实现数据持久化操作
# 数据导出
import pandas as pd
cars_info = pd.DataFrame([brand,title,boarding_time,km,discharge,sec_price,new_price]).T
cars_info = cars_info.rename(columns={0:‘Brand‘,1:‘Name‘,2:‘Boarding_time‘,3:‘Km‘,4:‘Discharge‘,5:‘Sec_price‘,6:‘New_price‘})
cars_info.to_csv(‘second_cars_info.csv‘, index=False)
6.附完整程序代码
# 导入第三方包
import requests
from bs4 import BeautifulSoup
import time

# 设置伪头
headers = {
    ‘Accept‘:‘*/*‘,
    ‘Accept-Encoding‘:‘gzip, deflate, br‘,
    ‘Accept-Language‘:‘zh-CN,zh;q=0.8‘,
    ‘Connection‘:‘keep-alive‘,
    ‘User-Agent‘:‘Mozilla/5.0 (Windows NT 6.1; WOW64) AppleWebKit/537.36 (KHTML, like Gecko) Chrome/61.0.3163.79 Safari/537.36‘
}
# 二手车主页的链接
url = ‘https://www.guazi.com/quanzhou/bmw/‘
# 发出抓取链接的请求并进一步解析
res = requests.get(url, headers = headers).text
soup = BeautifulSoup(res,‘html.parser‘)

# 抓取二手车品牌名称及对应的链接
car_brands = soup.findAll(‘div‘,{‘class‘:‘brand-name‘})
car_brands = [j for i in car_brands for j in i]
brands = [i.text for i in car_brands]
urls = [‘https://www.guazi.com/quanzhou/bmw/‘ + i[‘href‘] for i in car_brands]
# 生成所需抓取的目标链接
target_urls = []
target_brands = []
for b,u in zip(brands,urls):
    # 抓取各品牌二手车主页下的所有页码
    res = requests.get(u, headers = headers).text
    soup = BeautifulSoup(res,‘html.parser‘)
    # 查询出页数
    if len(soup.findAll(‘div‘,{‘class‘:‘the-pages‘})) == 0:
        pages = 1
    else:
        pages = int([page.text for page in soup.findAll(‘div‘,{‘class‘:‘the-pages‘})[0].findAll(‘a‘)][-2])
    time.sleep(3)

    for i in range(1,pages + 1):
        target_brands.append(b)
        target_urls.append(u+‘?page=‘+str(i)+‘#pagetag‘)
# 构建空列表,用于数据的存储
brand = []
title = []
boarding_time = []
km = []
discharge = []
sec_price = []
new_price = []

# 对每个链接发生请求
for b,u in zip(target_brands,target_urls):
    res = requests.get(u, headers = headers).text
    soup = BeautifulSoup(res,‘html.parser‘)
    # 每页车子的数量
    N = len([i.findAll(‘a‘)[0][‘title‘] for i in soup.findAll(‘div‘,{‘class‘:‘item_details‘})])
    try:
        # 车品牌
        brands = (b+‘-‘)*N
        brand.extend(brands.split(‘-‘)[:-1])
        # 车名称
        title.extend([i.findAll(‘a‘)[0][‘title‘] for i in soup.findAll(‘div‘,{‘class‘:‘item_details‘})])
        # 二手车的上牌时间、行驶里程数等信息
        info = [i.findAll(‘li‘) for i in soup.findAll(‘ul‘,{‘class‘:‘ul_news‘})]
        boarding_time.extend([i[0].text[4:] for i in info])
        km.extend([i[1].text[4:] for i in info])
        discharge.extend([i[3].text[4:] for i in info])
        sec_price.extend([float(i.findAll(‘h2‘)[0].text[:-1]) for i in soup.findAll(‘div‘,{‘class‘:‘item_price‘})])
        new_price.extend([i.findAll(‘p‘)[0].text.split(‘\xa0‘)[0][5:].strip() for i in soup.findAll(‘div‘,{‘class‘:‘item_price‘})])
    except IndexError:
        pass
    # 每4秒停顿一次
    time.sleep(4)
# 数据导出
import pandas as pd
cars_info = pd.DataFrame([brand,title,boarding_time,km,discharge,sec_price,new_price]).T
cars_info = cars_info.rename(columns={0:‘Brand‘,1:‘Name‘,2:‘Boarding_time‘,3:‘Km‘,4:‘Discharge‘,5:‘Sec_price‘,6:‘New_price‘})
cars_info.to_csv(‘second_cars_info.csv‘, index=False)
# 导入第三方模块
import pandas as pd
import numpy as np
import matplotlib.pyplot as plt
from nbconvert.exporters import python
from sklearn.linear_model import LinearRegression
# 可视化的中文处理
plt.rcParams[‘font.sans-serif‘] = ‘Microsoft YaHei‘
plt.rcParams[‘axes.unicode_minus‘] = False
# 设置风格
plt.style.use(‘ggplot‘)
# 读取数据
cars = pd.read_csv(‘second_cars_info.csv‘, encoding=‘utf-8‘)
# 取出上牌时间变量中的年和月
cars[‘year‘] = cars.Boarding_time.str[:4].astype(‘int‘)
month = cars.Boarding_time.str.findall(‘年(.*?)月‘)
# print(month.head(10))
# 由于month是列表构成的序列,所以需要非列表化,再序列化
month = pd.Series([i[0] for i in month]).astype(‘int‘)
cars[‘month‘] = month
# print(month.head(10))
# 计算上牌日期距离2017年10月份的月数
cars[‘diff_months‘] = (2017 - cars.year) * 12 + (10 - cars.month) + 1
# 显示数据的前5行
cars.head(5)
# 剔除“万公里”三个字
cars[‘Km_new‘] = cars.Km.str[:-3]
# 数值类型转换
cars.Km_new = cars.Km_new.astype(‘float‘)
# “百公里内”的样本量
N = np.sum(cars.Km == ‘百公里内‘)
Ratio = N / cars.shape[0]
# 将“百”字替换为0.005
cars.Km_new.replace(‘百‘, ‘0.005‘, inplace=True)
# 数据类型转换
cars.Km_new = cars.Km_new.astype(‘float‘)
cars.head()
# 删除字段中的“万”字
cars[‘New_price_new‘] = cars.New_price.str[:-1]
# “暂无”的样本量
N = np.sum(cars.New_price == ‘暂无‘)
Ratio = N / cars.shape[0]
cars = cars.loc[cars.New_price != ‘暂无‘, :]
# 数据类型的转换
cars.New_price_new = cars.New_price_new.astype(‘float‘)
cars.head()
# 数据集的概览信息
cars.describe()
# 行驶公里数的饼图展现
km_min = cars.Km_new.min()
km_max = cars.Km_new.max()
# 指定任意的切割点,将数据分段
km_cuts = pd.cut(cars.Km_new, bins=[km_min, 1, 3, 5, 10, km_max])
km_stats = km_cuts.value_counts()
# 绘制饼图
# 将横、纵坐标轴标准化处理.
plt.axes(aspect=‘equal‘)
# 提取出索引作为标签
labels = km_stats.index
# 自定义颜色
colors = [‘#9999ff‘, ‘#ff9999‘, ‘#7777aa‘, ‘#2442aa‘, ‘#dd5555‘]
# 绘制饼图
plt.pie(km_stats.values,
        labels=labels,
        colors=colors,  # 设置颜色
        autopct=‘%.1f%%‘,  # 设置百分比的格式,这里保留一位小数
        counterclock=False,  # 设置为顺时针方向显示图形
        wedgeprops={‘linewidth‘: 1.5, ‘edgecolor‘: ‘green‘},  # 设置饼图内外边界的属性值
        textprops={‘fontsize‘: 12, ‘color‘: ‘k‘}  # 设置文本标签的属性值
        )
# 添加图标题
plt.title(‘二手车行驶公里数分布(万公里)‘)
# 显示图形
plt.show()
四、结论(10分)
1.经过对主题数据的分析与可视化,可以得到哪些结论?
在瓜子二手车网站中行驶5到10万公里里程的车所占比例最多为53.7%,车的里程数与二手价格成反比,瓜子二手车网站提供给用户的数据较多,有车型,行车价格,二手车价格,里程数,上牌日期等。
2.对本次程序设计任务完成的情况做一个简单的小结。
让我更加熟悉python的诸多爬取方法,让我认识到了BeautifulSoup以及matplotlib爬取的可靠性,应对瓜子二手车网站的防爬手段我也试过多种方法找到了用js混淆,根据发送的原始header和js混淆生成特定的cookie访问到网站进行爬取。
标签:data oat int sum 可靠性 art frame 发动机 日期
原文地址:https://www.cnblogs.com/louis20161822/p/12072462.html