标签:画布 函数 spine legend 导入 sans img gen png
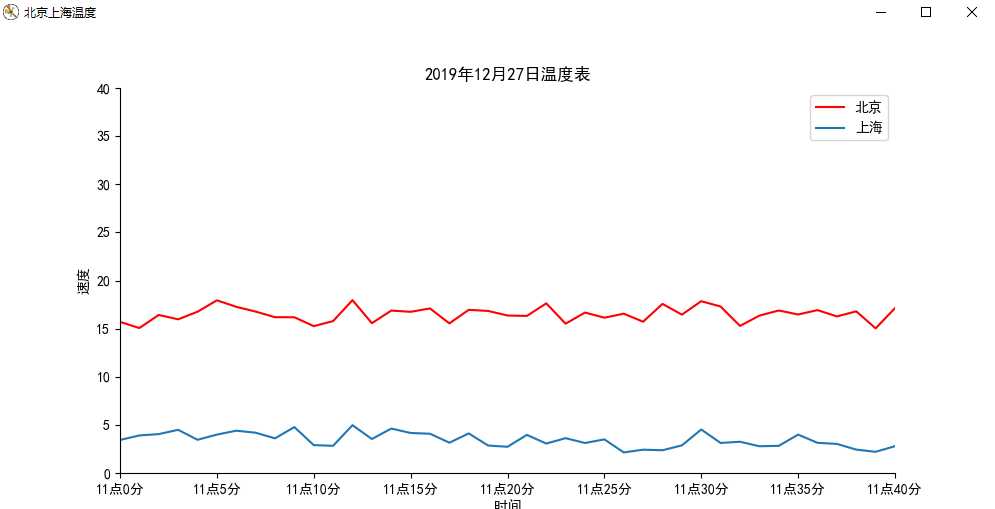
python matplotlib和random 折线图的制作
1.库的导入
import matplotlib.pyplot as plt  # 导入模块
import random
2.创建画布并设置中文
# 1)创建画布(容器层)
plt.figure("北京上海温度", figsize=(10, 5))  # 10为绘图对象长度,5为宽度
plt.rcParams[‘font.sans-serif‘] = [‘SimHei‘]  # 用来正常显示中文标签
plt.rcParams[‘axes.unicode_minus‘] = False  # 用来正常显示负号
plt.title("2019年12月27日温度表")
3.设置x和y轴的取值范围的对应数据
# 设置x轴取值范围
plt.xlim(0, 40)
# 设置y轴取值范围
plt.ylim(0, 40)
# 描述x轴
plt.xlabel("时间")
# 描述y轴
plt.ylabel("速度")

"""将x轴对应的参数显示对应的值"""
plt.xticks([0, 5, 10, 15, 20, 25, 30, 35, 40],
           ["11点0分", "11点5分", "11点10分", "11点15分", "11点20分", "11点25分", "11点30分", "11点35分", "11点40分"]
           )
4.随机产生x和y轴的数据
"""使用range函数随机产生y轴的数据"""
x = range(41)
y = [random.uniform(15, 18) for _ in x]
y_beijing = [random.uniform(2, 5) for _ in x]
5.将右上方边框去掉
"""将上右方向的边框去掉"""
ax = plt.gca()
ax.spines["top"].set_color("none")
ax.spines["right"].set_color("none")
6.画制折线图
plt.plot(x, y, color="red", label="北京")
plt.plot(x, y_beijing, label="上海")
"""设置右上方的提示"""
# 设置默认
plt.legend()
# 3)显示图像
plt.show()

标签:画布 函数 spine legend 导入 sans img gen png
原文地址:https://www.cnblogs.com/love2000/p/12118323.html