标签:默认值 pytho from sort line read arch 字符串 value
1.图
2.代码
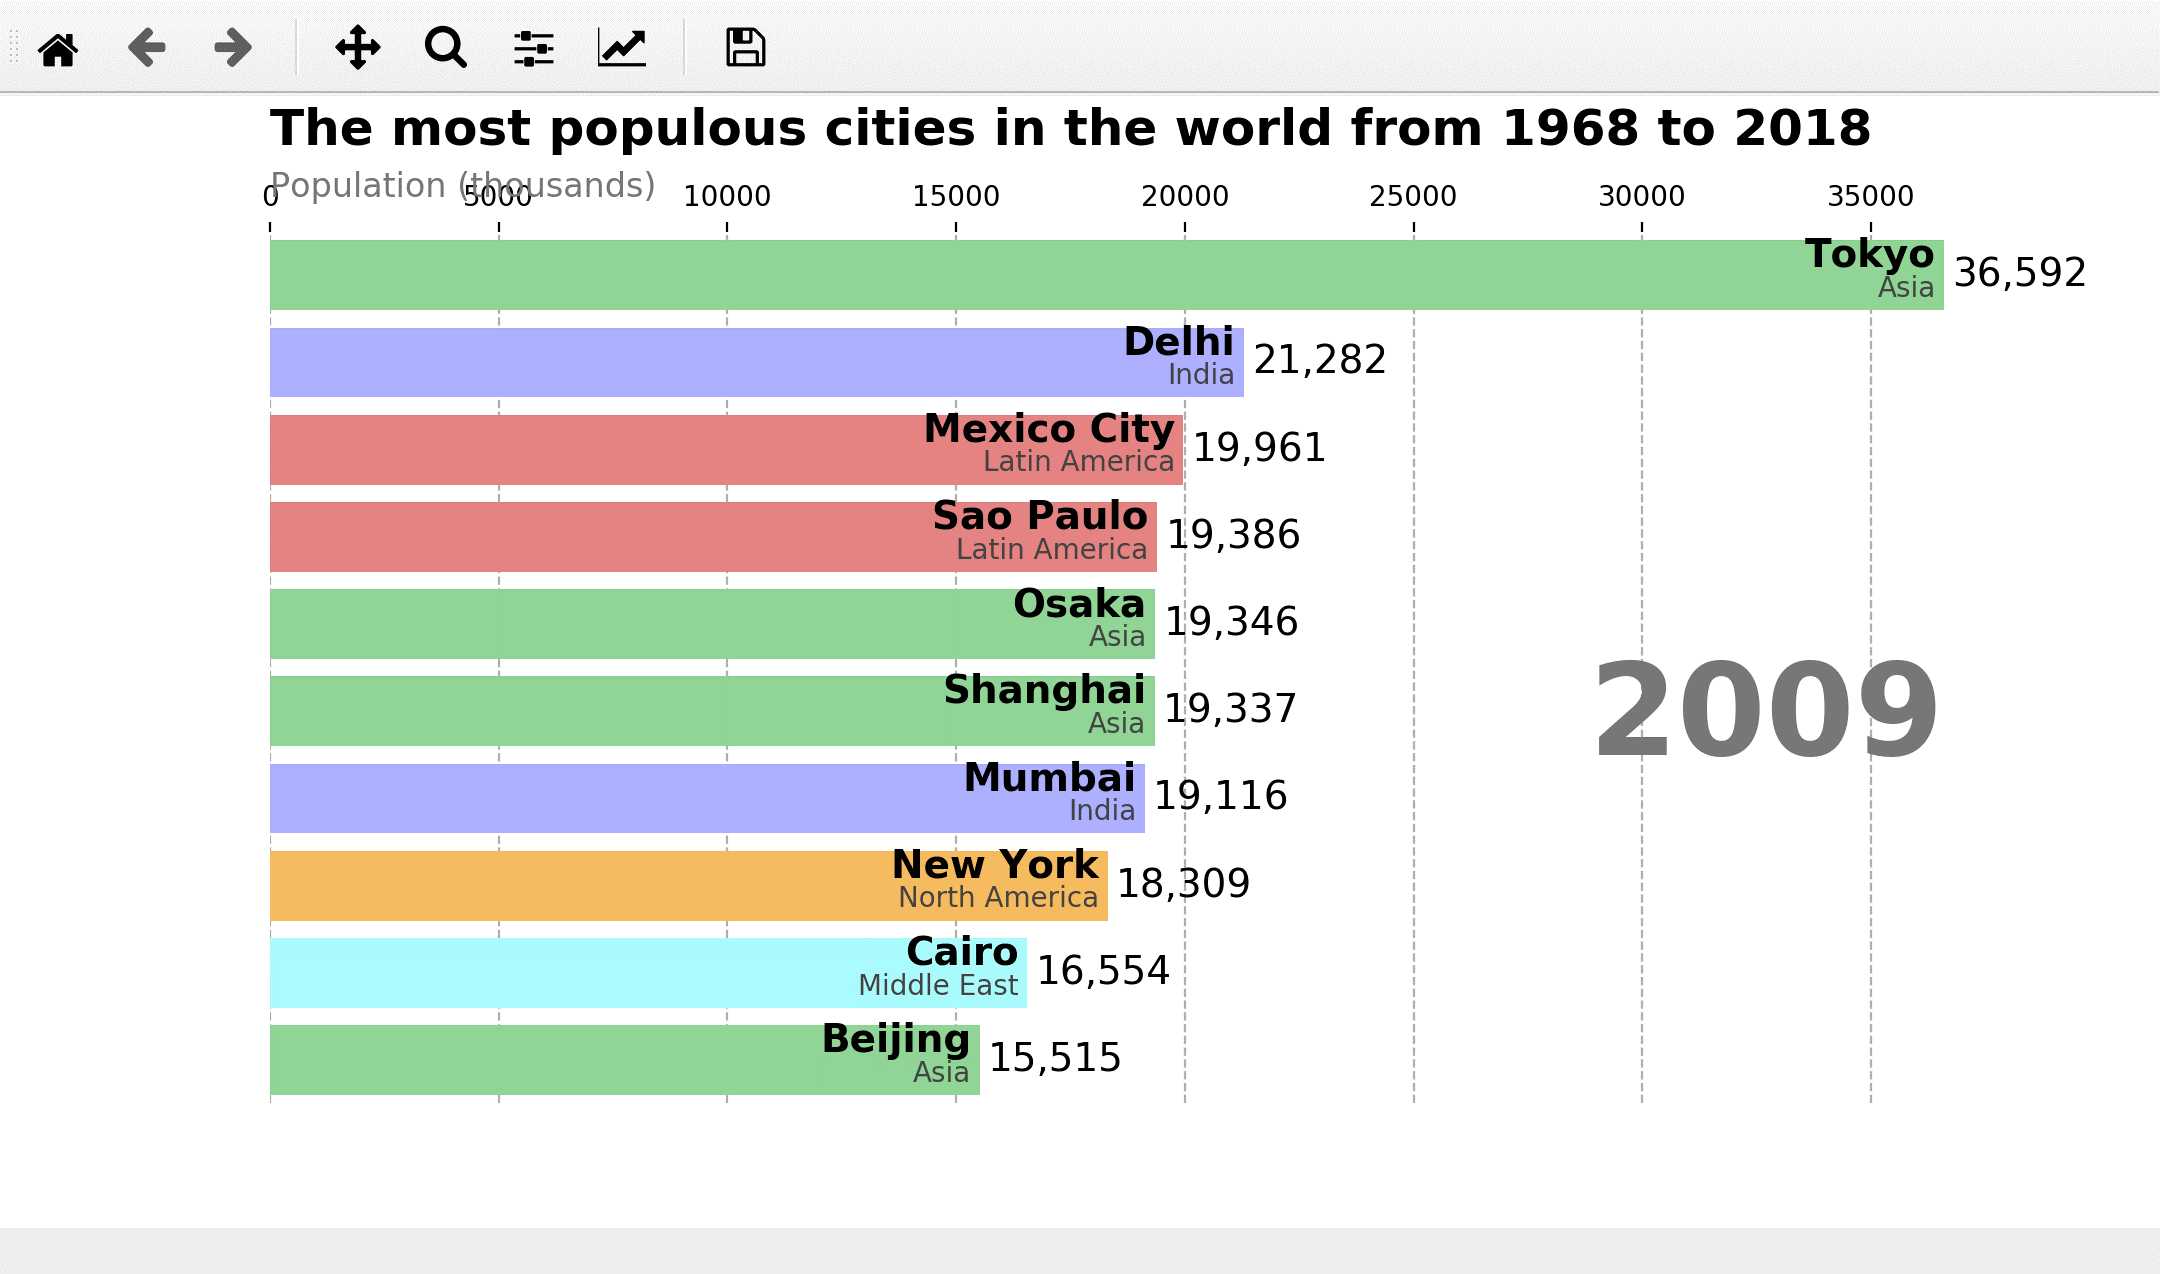
import pandas as pd
import matplotlib as mpl
import matplotlib.pyplot as plt
import matplotlib.ticker as ticker
import matplotlib.animation as animation
#导出数据,当然这个数据也可以是直接在网上下载,是的有点慢
#网址:https://gist.githubusercontent.com/johnburnmurdoch/4199dbe55095c3e13de8d5b2e5e5307a/raw/fa018b25c24b7b5f47fd0568937ff6c04e384786/city_populations
df = pd.read_csv(‘city_populations.csv‘,
                 usecols=[‘name‘, ‘group‘, ‘year‘, ‘value‘]) #将数据下载下来放在指定默认的目录和文件夹下,city_populations.csv
#定义
current_year = 2018
dff=()

fig, ax = plt.subplots(figsize=(15, 8))

colors = dict(zip(
    [‘India‘, ‘Europe‘, ‘Asia‘, ‘Latin America‘,
     ‘Middle East‘, ‘North America‘, ‘Africa‘],
    [‘#adb0ff‘, ‘#ffb3ff‘, ‘#90d595‘, ‘#e48381‘,
     ‘#aafbff‘, ‘#f7bb5f‘, ‘#eafb50‘]
))

group_lk = df.set_index(‘name‘)[‘group‘].to_dict()

def draw_barchart(year):
    dff = df[df[‘year‘].eq(year)].sort_values(by=‘value‘, ascending=True).tail(10)
    ax.clear() #每次清空、刷新
    ax.barh(dff[‘name‘], dff[‘value‘], color=[colors[group_lk[x]] for x in dff[‘name‘]])
    dx = dff[‘value‘].max() / 200
    for i, (value, name) in enumerate(zip(dff[‘value‘], dff[‘name‘])):
        ax.text(value-dx, i,     name,           size=14, weight=600, ha=‘right‘, va=‘bottom‘)
        ax.text(value-dx, i-.25, group_lk[name], size=10, color=‘#444444‘, ha=‘right‘, va=‘baseline‘)
        ax.text(value+dx, i,     f‘{value:,.0f}‘,  size=14, ha=‘left‘,  va=‘center‘)
    #显示文字,x=0,y=1.10,坐标,ha=水平对准=水平线平放
    #ax.text()格式=(x,y,string,fontsize=15,verticalalignment="top",horizontalalignment="right")
    #string=字符串=‘文字内容‘
    ax.text(0, 1.10, ‘The most populous cities in the world from 1968 to 2018‘,
            transform=ax.transAxes, size=18, weight=600, ha=‘left‘) #文字标题,第1层
    ax.text(0, 1.04, ‘Population (thousands)‘, transform=ax.transAxes, size=12, color=‘#777777‘) #显示文字,第2层
    ax.text(1, 0.4, year, transform=ax.transAxes, color=‘#777777‘, size=46, ha=‘right‘, weight=800) #右边固定显示动图年份
    #va=verticalalignment="top",垂直对准
    #ha=horizontalalignment="right",alignment=对准,水平对准
    ax.xaxis.set_ticks_position(‘top‘)  #x轴在上面

    ax.set_yticks([]) #默认是显示y轴的名称,左边垂直的城市名字,设为[]就是不显示
    ax.margins(0, 0.01) #不设置就是默认值,缩放比例(0,0.05)
    ax.grid(which=‘major‘, axis=‘x‘, linestyle=‘--‘) #垂直线,布局和格式
    ax.set_axisbelow(True)  #默认是true的

    plt.box(False) #默认是True,False之后不显示黑色线框

animator = animation.FuncAnimation(fig, draw_barchart, frames=range(1968, 2019)) #以animator形式展现动画
plt.show() #以plt的形式展现图片
标签:默认值 pytho from sort line read arch 字符串 value
原文地址:https://www.cnblogs.com/ysysbky/p/12189816.html