标签:line inpu art cat def isa 输入 style ips
我的理解:在光栅图形学中,由于每一个点的表示都只能是整数值,所以光栅图形学实际只是对对实际图形的近似表示。
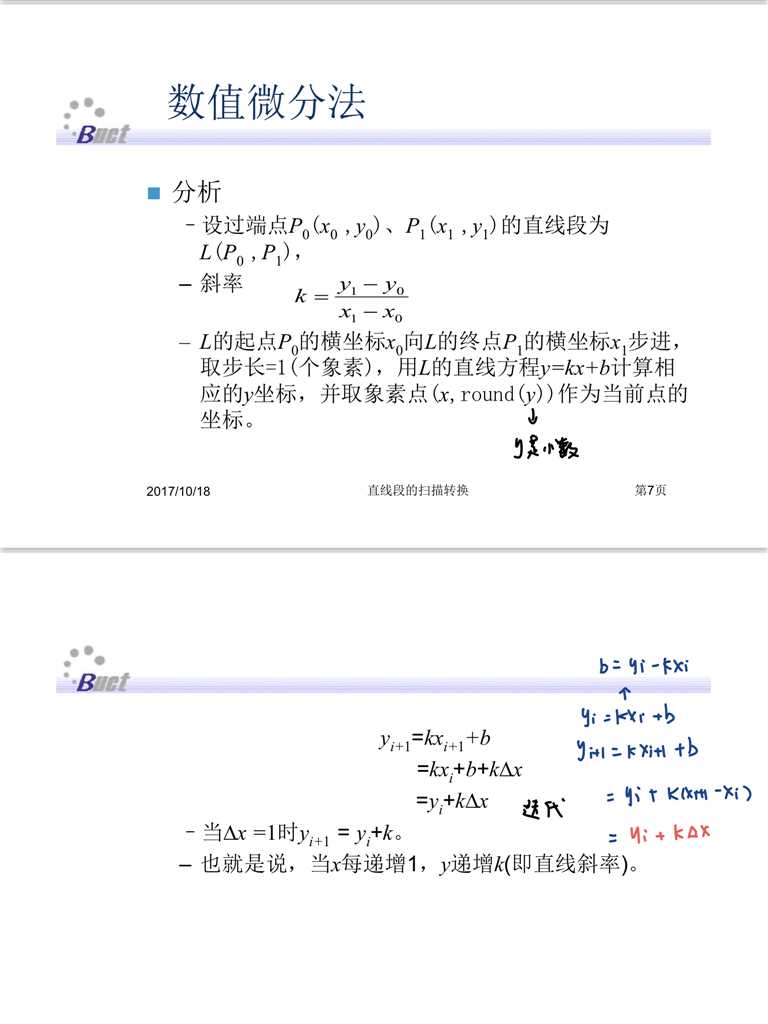
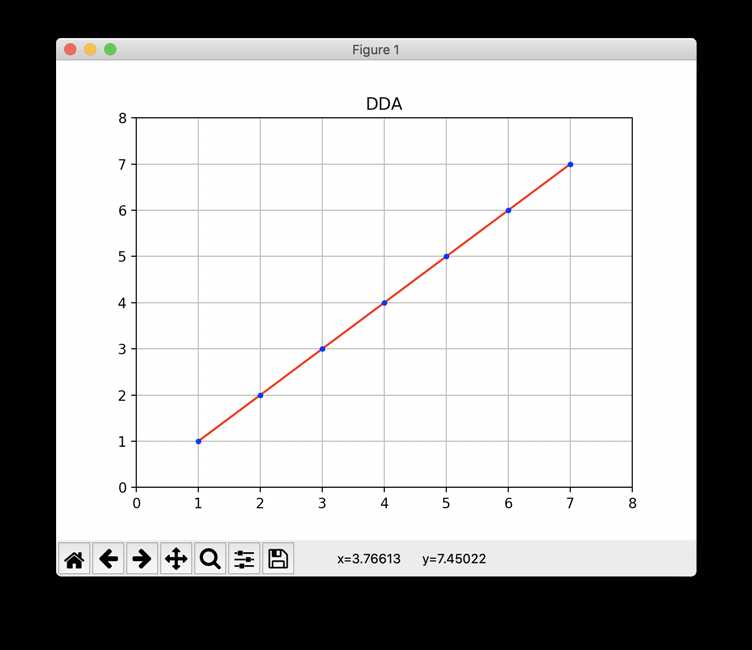
数值微分法(DDA):以下PPT截图来自北京化工大学李辉老师
代码实现:
import matplotlib.pyplot as plt
import matplotlib.patches as patches
from pylab import *


def init(ax):

    #将主标签设置为1的倍数
    majorLocator = MultipleLocator(1);
    #设置主刻度标签的位置,标签文本的格式
    ax.xaxis.set_major_locator(majorLocator);
    ax.yaxis.set_major_locator(majorLocator);
    ax.grid(True);


if __name__ == ‘__main__‘:

    x0, y0, x1, y1 = map(int, input("请输入直线的起点与终点: ").split(‘ ‘))
    ax = subplot(title=‘DDA‘);
    ax.plot([x0, x1], [y0, y1], ‘r‘);
    delta_x = x1-x0;
    delta_y = y1-y0;
    #画坐标轴
    if x1>y1:
        ax.axis([x0-1, x1+1, y0-1, x1+1]);
        init(ax);
    else:
        ax.axis([x0-1, y1+1, y0-1, y1+1]);
        init(ax);
    #计算斜率k的值
    if delta_x == 0:
        k = 999999999;
    else:
        k = delta_y / delta_x;
    #如果|k|<=1
    if k>-1 and k<1:
        while x0<=x1:
            x = round(x0);
            y = round(y0);
            ax.plot(x, y, ‘b.‘);
            x0 += 1;
            y0 = y0+k;
    else:
        while y0<=y1:
            x = round(x0);
            y = round(y0);
            ax.plot(x, y, ‘b.‘);
            x0 += 1/k;
            y0 += 1;
    plt.show();
运行截图:
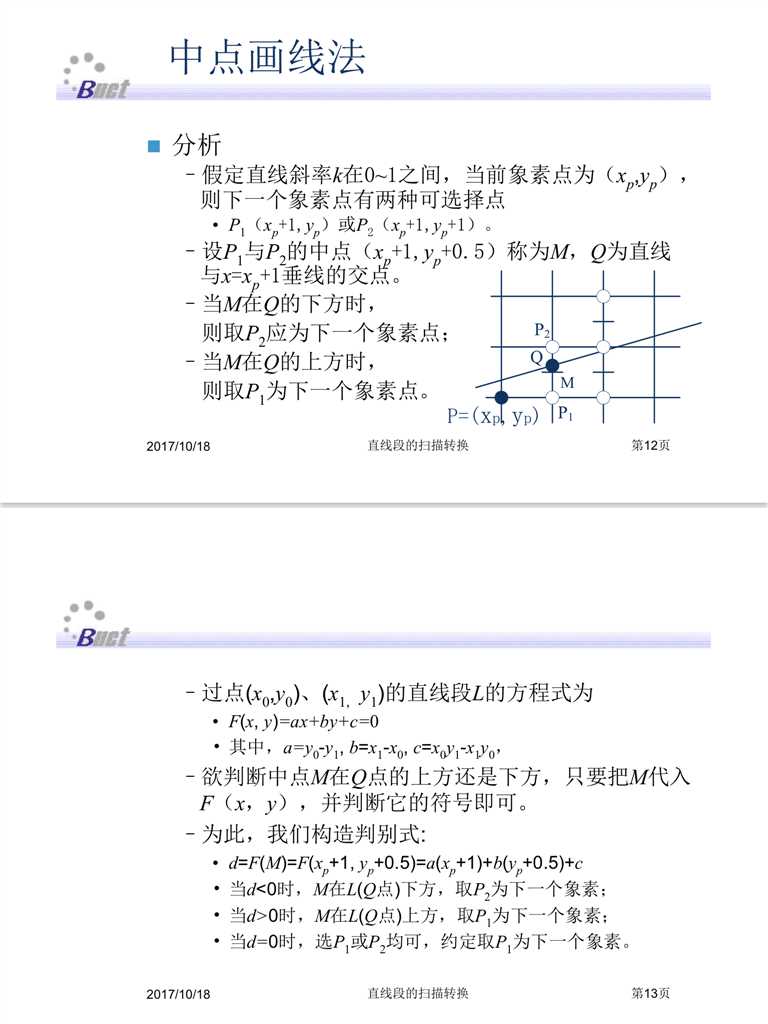
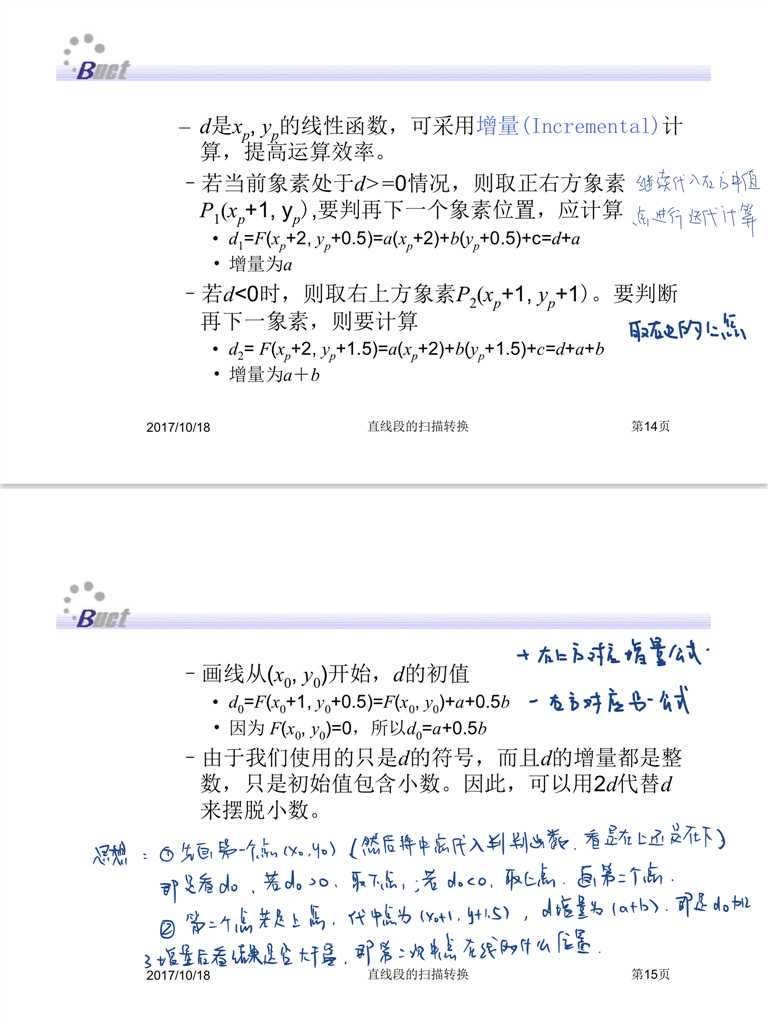
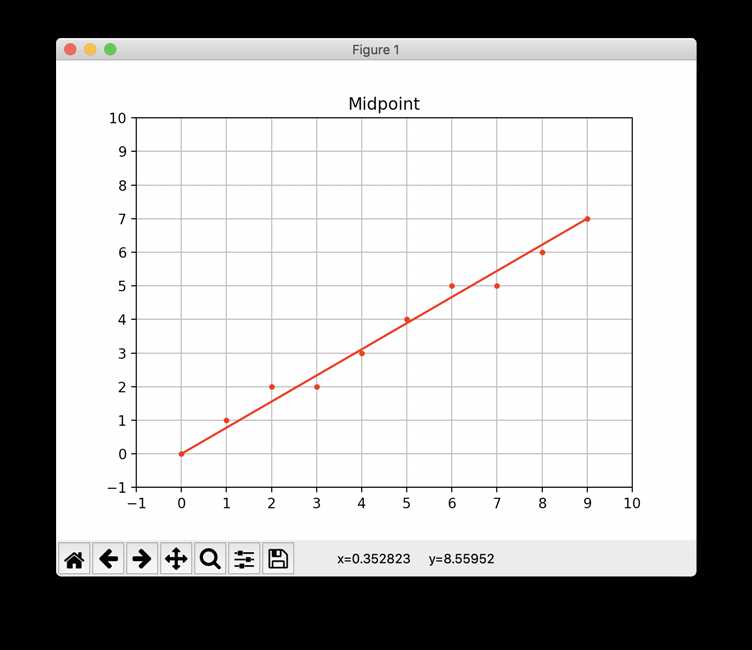
中点画线:以下PPT截图来自北京化工大学李辉老师
代码实现:
wimport matplotlib.pyplot as plt
import matplotlib.patches as patches
from pylab import *


def init(ax):

    #将主标签设置为1的倍数
    majorLocator = MultipleLocator(1);
    #设置主刻度标签的位置,标签文本的格式
    ax.xaxis.set_major_locator(majorLocator);
    ax.yaxis.set_major_locator(majorLocator);
    ax.grid(True);

if __name__ == ‘__main__‘:

    x0, y0, x1, y1 = map(int, input("请输入直线的起点与终点: ").split(‘ ‘))
    ax = subplot(title=‘Midpoint‘);
    ax.plot([x0, x1], [y0, y1], ‘r‘);
    a = y0-y1;
    b = x1-x0;
    d = 2*a+b;
    d1 = 2*a;
    d2 = 2*(a+b);
    #画坐标轴
    if x1>y1:
        ax.axis([x0-1, x1+1, y0-1, x1+1]);
        init(ax);
    else:
        ax.axis([x0-1, y1+1, y0-1, y1+1]);
        init(ax);

    x = x0;
    y = y0;
    ax.plot(x, y, ‘r.‘);
    while(x < x1):
        if d<0:
            x += 1;
            y += 1;
            d += d2;
        else:
            x += 1;
            d += d1;
        ax.plot(x, y, ‘r.‘);
    plt.show()
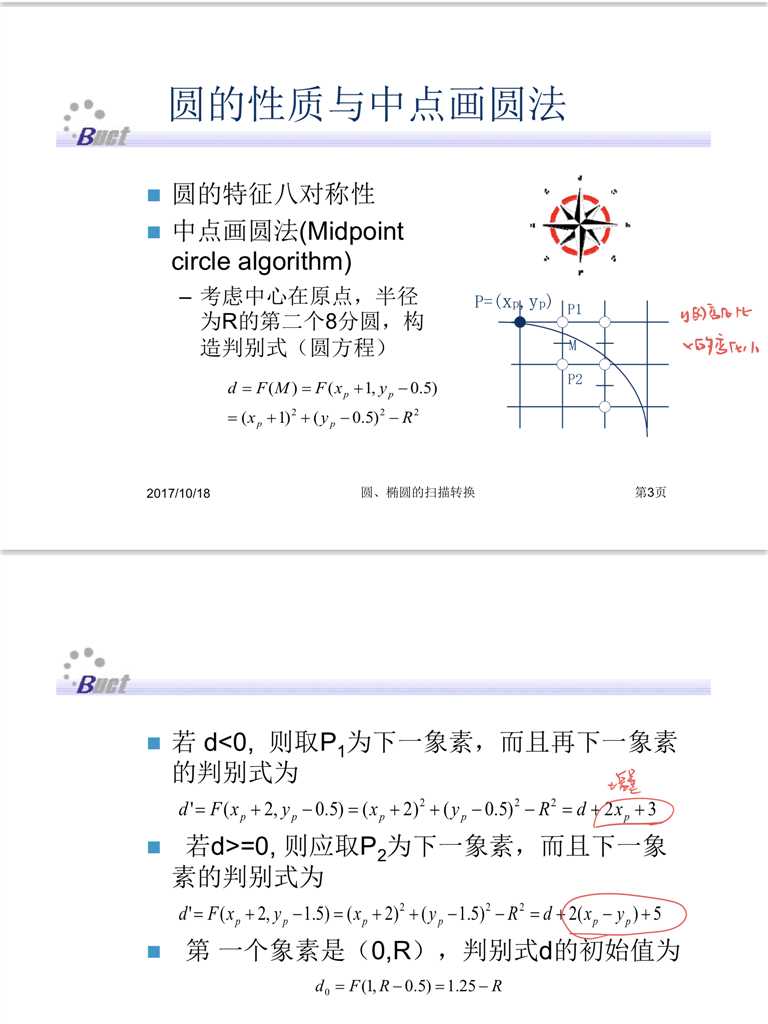
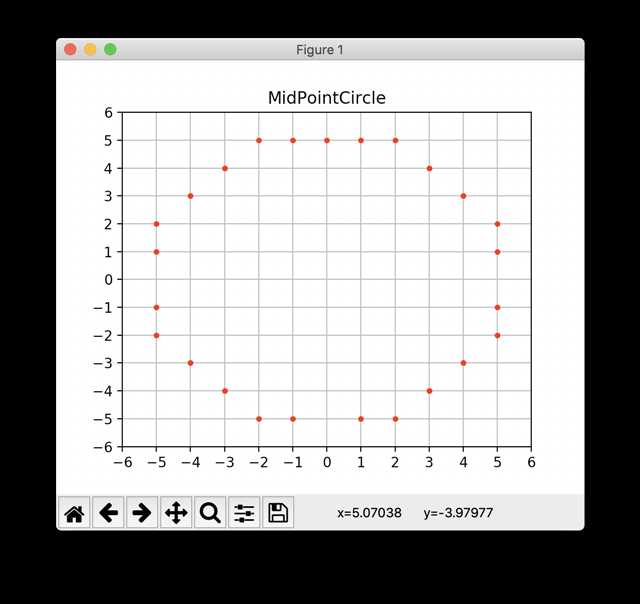
中点画圆法:以下PPT截图来自北京化工大学李辉老师
import matplotlib.pyplot as plt
import matplotlib.patches as patches
from pylab import *


def init(ax):

    #将主标签设置为1的倍数
    majorLocator = MultipleLocator(1);
    #设置主刻度标签的位置,标签文本的格式
    ax.xaxis.set_major_locator(majorLocator);
    ax.yaxis.set_major_locator(majorLocator);
    ax.grid(True);

if __name__ == ‘__main__‘:

    r = int(input("请输入半径: "));
    plt.figure(figsize=(r*0.1, r*0.1));
    ax = subplot(title=‘MidPointCircle‘);
    d = 1-r;
    ax.axis([-r-1, r+1, -r-1, r+1]);
    init(ax);

    x = 0;
    y = r;
    ax.plot(x, y, ‘r.‘);
    while(x <= y):
        if d<0:
            d += 2*x+3;
        else:
            d += 2*(x-y)+5;
            y -= 1;
        x += 1;
        ax.plot(x, y, ‘r.‘);
        ax.plot(y, x, ‘r.‘);
        ax.plot(x, -y, ‘r.‘);
        ax.plot(-y, x, ‘r.‘);
        ax.plot(-x, y, ‘r.‘);
        ax.plot(y, -x, ‘r.‘);
        ax.plot(-x, -y, ‘r.‘);
        ax.plot(-y, -x, ‘r.‘);
    plt.show()
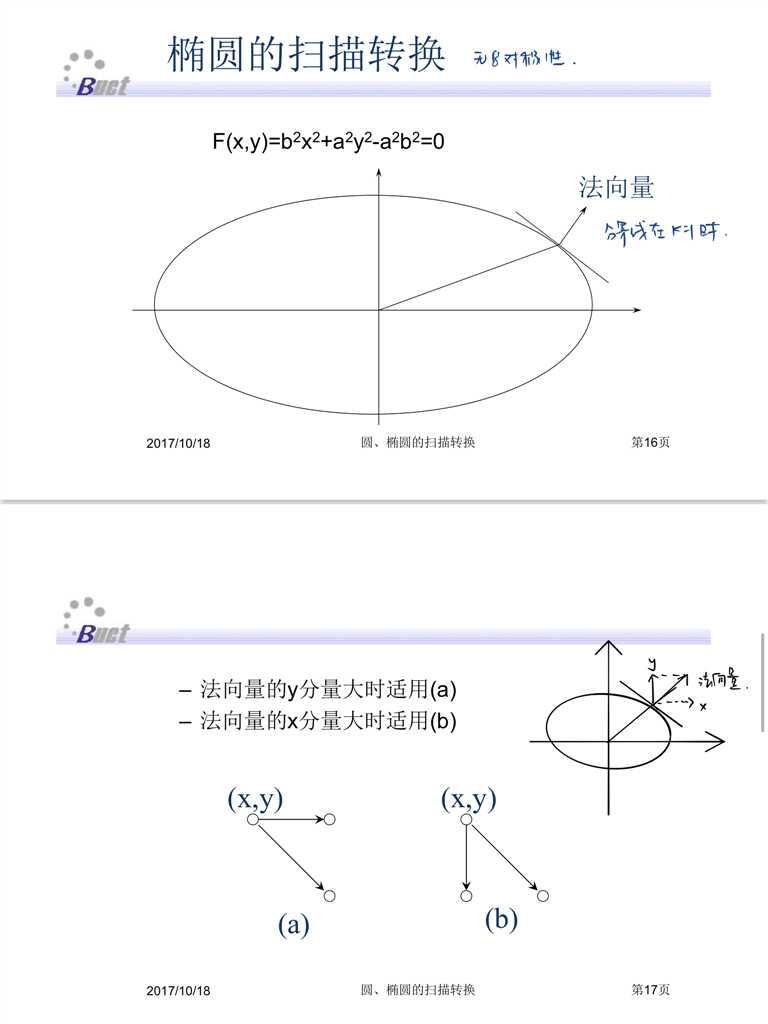
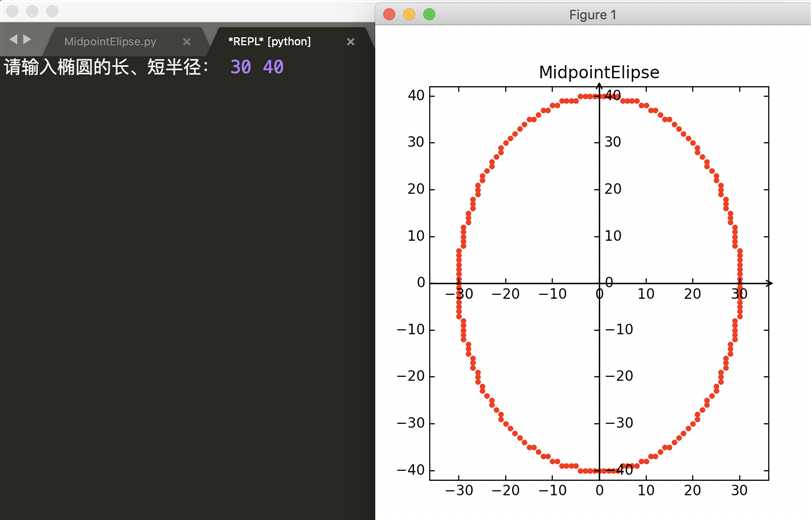
椭圆的扫描转换:以下PPT截图来自北京化工大学李辉老师
代码实现:
import matplotlib.pyplot as plt
import matplotlib.patches as patches
import mpl_toolkits.axisartist as axisartist
from pylab import *


def init(ax):
    #设置x轴:空心箭头、数值在下方
    ax.axis["x"] = ax.new_floating_axis(0, 0);
    ax.axis["x"].set_axisline_style("->", size = 1.0);
    ax.axis["x"].set_axis_direction("bottom");

    #设置y轴:空心箭头、数值在右方
    ax.axis["y"] = ax.new_floating_axis(1, 0);
    ax.axis["y"].set_axisline_style("->", size = 1.0);
    ax.axis["y"].set_axis_direction("right");

if __name__ == ‘__main__‘:

    a, b = map(int, input("请输入椭圆的长、短半径: ").split(‘ ‘));
    fig = plt.figure(figsize=(5, 7))
    #初始化画布
    ax = axisartist.Subplot(fig, 111, title=‘MidpointElipse‘);
    #将绘图区对象添加到画布中
    fig.add_axes(ax)
    init(ax);

    x = 0;
    y = b;
    d1 = b*b+a*a*(-b+0.25); #增量初值
    ax.plot(x, y, ‘r.‘);
    ax.plot(x, -y, ‘r.‘);

    while(b*b*(x+1)<a*a*(y-0.5)): #法向量的x、y不一样大时
        if d1<0:
            d1 += b*b*(2*x+3);
            x += 1;
        else:
            d1 += b*b*(2*x+3)+a*a*(-2*y+2);
            x += 1;
            y -= 1;
        #画四个对称点
        ax.plot(x, y, ‘r.‘);
        ax.plot(x, -y, ‘r.‘);
        ax.plot(-x, y, ‘r.‘);
        ax.plot(-x, -y, ‘r.‘);

    #画到了法向量的x=y,即椭圆弧的下半部分
    d2 = b*b*(x+0.5)*(x+0.5)+a*a*(y-1)*(y-1)-a*a*b*b;
    while y>0: #终结条件y>0
        if d2<0:
            d2 += b*b*(2*x+2)+a*a*(-2*y+3);
            x += 1;
            y -= 1;
        else:
            d2 += a*a*(-2*y+3);
            y -= 1;
        ax.plot(x, y, ‘r.‘);
        ax.plot(x, -y, ‘r.‘);
        ax.plot(-x, y, ‘r.‘);
        ax.plot(-x, -y, ‘r.‘);

    plt.show()
标签:line inpu art cat def isa 输入 style ips
原文地址:https://www.cnblogs.com/swenw/p/12232334.html