标签:alt ott read des uniq for title and result
第一步:
安装pyecharts:
pip install pyecharts
第二步:整理数据
第三步:读入数据,画图
import pandas as pd
from pyecharts.charts import Page
from pyecharts.charts import Sankey
from pyecharts import options as opts
data=pd.read_csv(r‘D:\\Desktop\\test3.csv‘,encoding=‘gbk‘,header=None)
nodes=[]
nodes.append({‘name‘:‘所有产业‘})
for i in data[0].unique():
    dic={}
    dic[‘name‘]=i
    nodes.append(dic)
print(nodes)
links=[]
for i in data.values:
    dic={}
    dic[‘source‘]=i[0]
    dic[‘target‘]=i[1]
    dic[‘value‘]=i[2]
    links.append(dic)
c=(
    Sankey()
    .add(
        "费用",
        nodes,
        links,
        linestyle_opt=opts.LineStyleOpts(opacity=0.2,curve=0.5,color="source",type_="dotted"),
        label_opts=opts.LabelOpts(position="right",),
    )
    .set_global_opts(title_opts=opts.TitleOpts(title="行业一览表"))
)
c.render(‘result1.html‘)
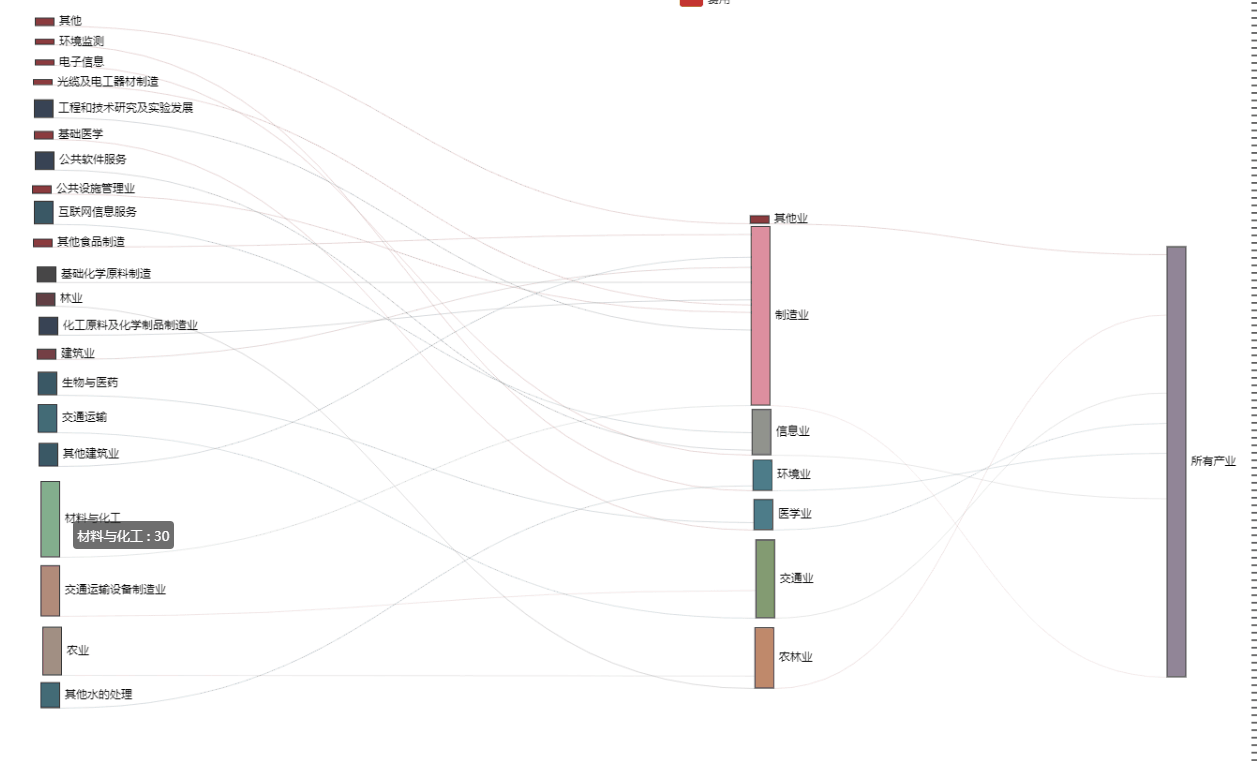
运行结果:

总结:好用,简单易上手。
参考链接:http://www.360doc.com/content/19/0830/12/1489589_858033982.shtml
标签:alt ott read des uniq for title and result
原文地址:https://www.cnblogs.com/zmh-980509/p/12547694.html