标签:which img pch 调整 gen png 生成 图片 inf
1、运行
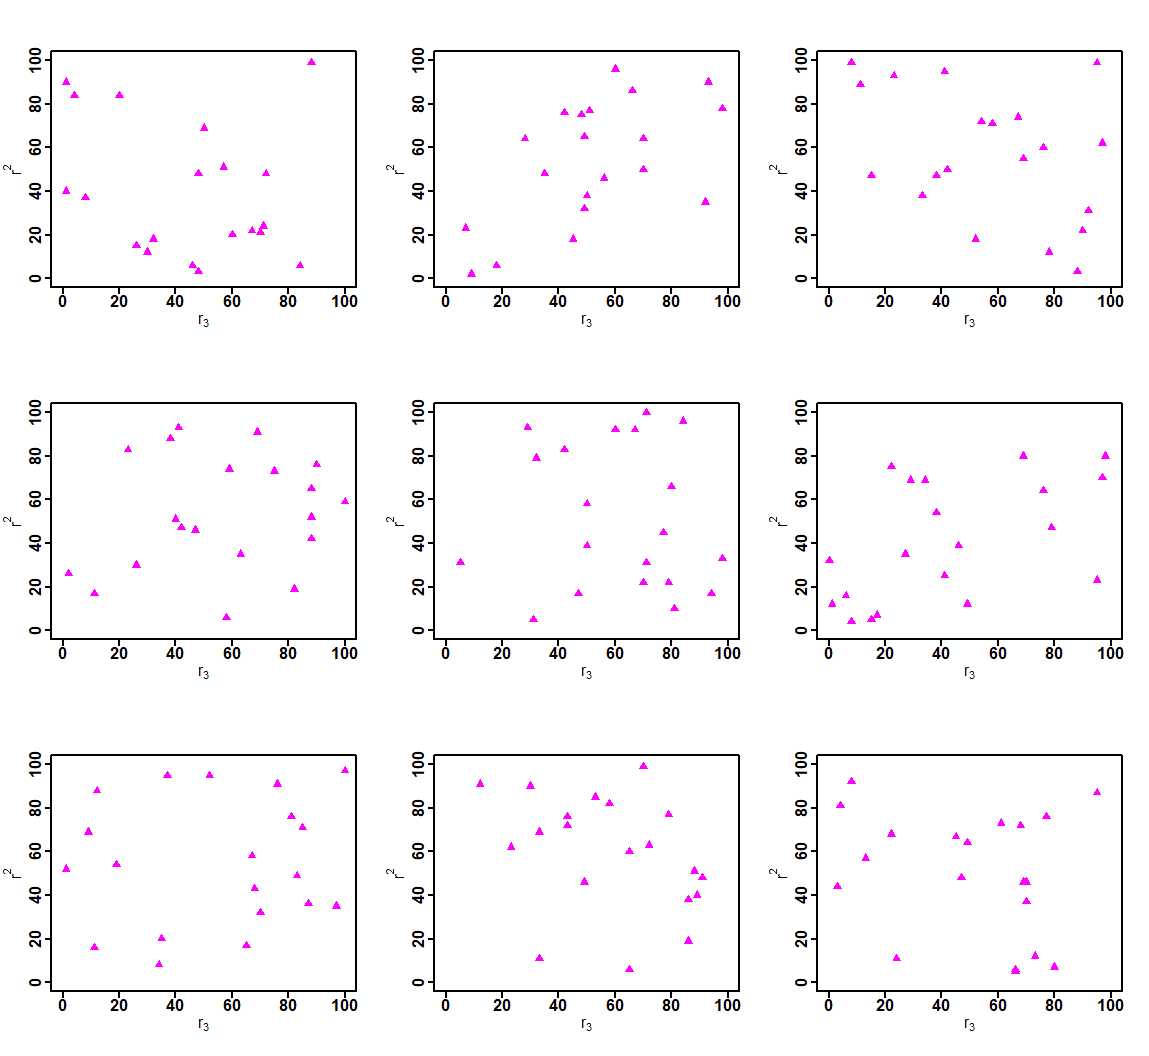
par(mfrow = c(3,3),mgp = c(2.3,0.67,0))  ## 设定绘图数量,绘图区域的边距。

##以下代码运行九次。因为上面 mfrow = c(3,3),设置了绘图区域一共绘制3行3列共九张图。
x1 <- round(runif(20,0,100)) ## 生成20各0~100的均匀分布的随机数。
y1 <- round(runif(20,0,100))
plot(x1,y1,pch = 17,cex = 1.5,col = "magenta",cex.axis = 1.5,
     cex.lab = 1.5,font.axis = 2,font.lab = 2,xlim = c(0,100),
     ylim = c(0,100),xlab = expression(r[3]),ylab = expression(r^2),
     lwd.ticks = 2.5) ## 调整参数,可以观测每个参数的效应
box(which = "plot",col = "black",lwd = 2.6) ## 调整绘图边框
2、绘图结果

标签:which img pch 调整 gen png 生成 图片 inf
原文地址:https://www.cnblogs.com/liujiaxin2018/p/12945734.html