标签:数据 numpy src bsp 字体 范围 标签 加载 pos
01、加载库
import numpy as np
import pandas as pd
import matplotlib.pyplot as plt
02、示例数据
x = np.linspace(-np.pi*2, np.pi*2)
y1 = np.sin(x)
y2 = np.power(x, 2) * 0.05 # 指数运算
df = pd.DataFrame({‘a‘: y1, ‘b‘: y2}, index=x)
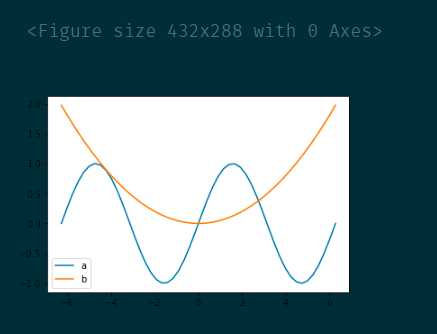
1、默认设置下的图形
fig = plt.figure()
df.plot()
plt.show()
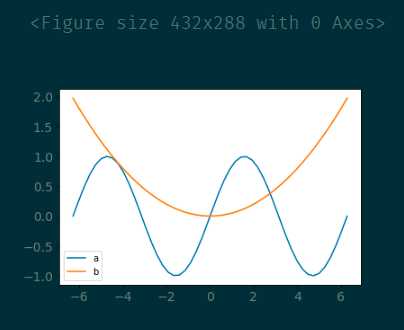
2、设置坐标轴标签字体大小和颜色
fig = plt.figure()
df.plot()
plt.yticks(size=14, color=‘grey‘)
plt.xticks(size=14, color=‘grey‘)
plt.show()
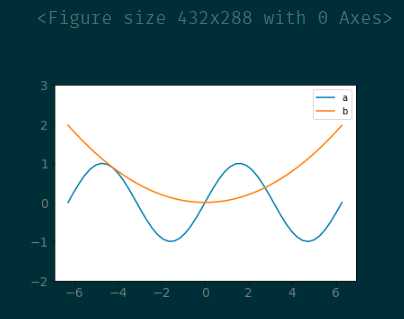
3、更改竖轴刻度范围
fig = plt.figure()
df.plot()
plt.ylim(-2, 3)
plt.yticks(size=14, color=‘grey‘)
plt.xticks(size=14, color=‘grey‘)
plt.show()
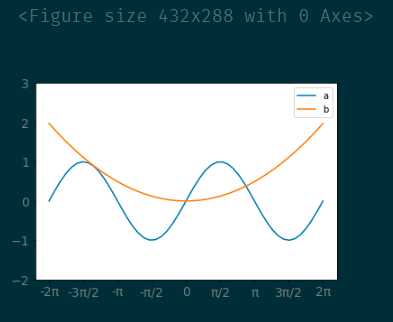
4、更换横轴刻度标签
xticks = [-2*np.pi, -3*np.pi/2, -np.pi, -np.pi/2,  0, np.pi/2, np.pi, 3*np.pi/2, 2*np.pi]
xticklabes = [‘-2π‘, ‘-3π/2‘, ‘-π‘, ‘-π/2‘, 0, ‘π/2‘, ‘π‘, ‘3π/2‘, ‘2π‘ ]
fig = plt.figure()
df.plot()
plt.ylim(-2, 3)
plt.yticks(size=14, color=‘grey‘)
plt.xticks(xticks, xticklabes, size=14, color=‘grey‘)
plt.show()
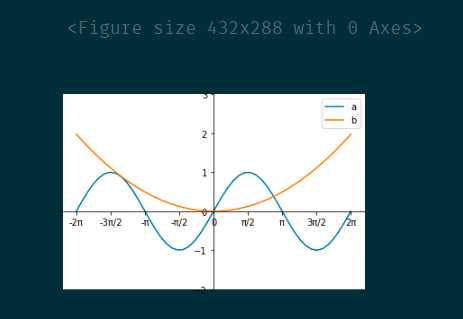
5、 移动坐标轴到中心
xticks = [-2*np.pi, -3*np.pi/2, -np.pi, -np.pi/2,  0, np.pi/2, np.pi, 3*np.pi/2, 2*np.pi]
xticklabes = [‘-2π‘, ‘-3π/2‘, ‘-π‘, ‘-π/2‘, 0, ‘π/2‘, ‘π‘, ‘3π/2‘, ‘2π‘ ]
fig = plt.figure()


df.plot()
ax = plt.gca()
plt.ylim(-2, 3)
plt.yticks(size=14, color=‘grey‘)
plt.xticks(xticks, xticklabes, size=14, color=‘grey‘)


ax.spines[‘right‘].set_color(‘none‘)
ax.spines[‘top‘].set_color(‘none‘)
ax.spines[‘left‘].set_position((‘data‘, 0))
ax.spines[‘bottom‘].set_position((‘data‘, 0))

plt.show()
标签:数据 numpy src bsp 字体 范围 标签 加载 pos
原文地址:https://www.cnblogs.com/shanger/p/13025983.html