标签:图片 方便 生成 取值 margin http alt math 图像
需要的库:matplotlib
用法:
import matplotlib.pyplot as plt
plt.plot(x, y) #x, y是两个列表
plt.show()
例子:
import matplotlib.pyplot as plt
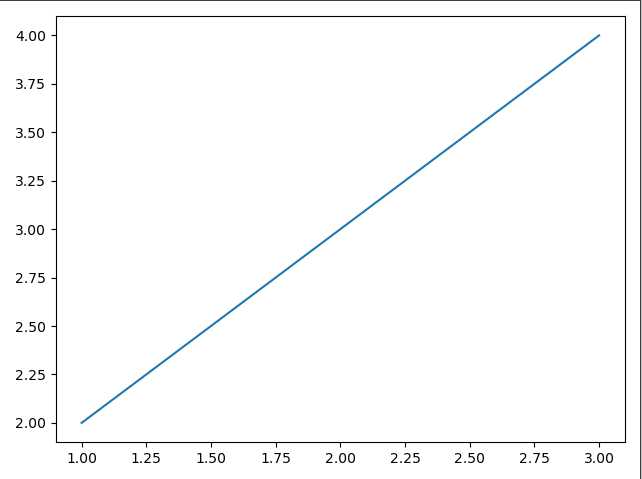
x = [1, 2, 3]
y = [2, 3, 4]
plt.plot(x, y) #x, y是两个列表
plt.show()
效果如下:

实际上,x, y的点越多,图像越精确,我们可以用numpy库生成方便的x,y
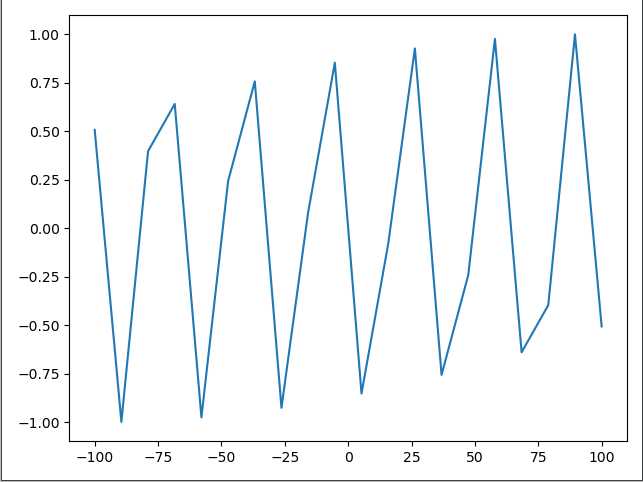
当点数量不足的时候,图像可能大相径庭
比如
import matplotlib.pyplot as plt
import numpy as np
import math
x = np.linspace(-100, 100, 20)   #分别代表最小,最大,数量, 生成一个等差数列
y = [math.sin(t) for t in x]
plt.plot(x, y)
plt.show()
本意是输出 y = sin(x) 的图像, 实际上的结果是:

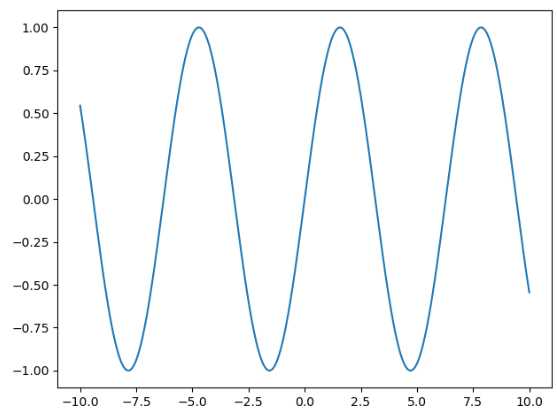
当我们把点数量增加到1000
import matplotlib.pyplot as plt
import numpy as np
import math
x = np.linspace(-10, 10, 1000)
y = [math.sin(t) for t in x]
plt.plot(x, y)
plt.show()
效果:

我们可以改变y的取值生成各种函数图像。
标签:图片 方便 生成 取值 margin http alt math 图像
原文地址:https://www.cnblogs.com/tstk/p/13055468.html