标签:点击 统计 sre 数据源 proc rollback figure 转换 base
Spring Boot 默认的指标数据从哪来的?原创 Queena 锅外的大佬 2019-08-08
点击左上角蓝字,关注“锅外的大佬”
专注分享国外最新技术内容
了解有关 Spring Boot 默认指标及其来源的更多信息。
您是否注意到 Spring Boot 和 Micrometer 为您的应用生成的所有默认指标?如果没有 - 您可以将 actuator 依赖项添加到项目中,然后点击 / actuator / metrics 端点,在那里您将找到有关 JVM 、进程、Tomcat、流量等的有用信息。然后,添加一些缓存,数据源 或 JPA 依赖项,甚至会出现更多指标。如果您想知道它们是如何结束的,我们可以在哪里找到关于它们所描述的参数的解释,那么这篇文章就是为您准备的。
为了让它井然有序,让我们从如何在 Spring Boot 应用程序中显示指标开始。如果您已经知道了,可以跳过这一部分。
Spring Boot中的指标由 micrometer.io 处理。但是,如果您使用 actuator ,则不需要向项目添加 micrometer 依赖项,因为 actuator 已经依赖于它。即使您对它提供的端点不感兴趣,也希望您使用 actuator ,因为这是通过其 AutoConfigurations 注册许多指标的模块。稍后我们会详细讨论。
因此,首先,只需将执行器依赖项添加到项目中(这里是 build.gradle.kts )
dependencies {
    implementation("org.springframework.boot:spring-boot-starter-actuator")
}
并在执行器端点中显示指标名称,点击 http://localhost:8080/actuator/metrics.
{
  "names": [
    "jvm.threads.states",
    "process.files.max",
    "jvm.memory.used",
    "jvm.gc.memory.promoted",
    "jvm.memory.max",
    "system.load.average.1m",
    ...
  ]
}
然后,要查看详细信息,请在 URL 路径中添加指标名称,例如:http://localhost:8080/actuator/metrics/system.cpu.count.
{
  "name": "system.cpu.count",
  "description": "The number of processors available to the Java virtual machine",
  "baseUnit": null,
  "measurements": [
    {
      "statistic": "VALUE",
      "value": 8
    }
  ],
  "availableTags": [
  ]
}
通过提供特定的仪表注册表,可以定期将这些指标发送到您选择的指标系统( Prometheus,New Relic,CloudWatch,Graphite 等)。让我们用最简单的注册表来做 - LoggingMeterRegistry,它只是定期记录所有指标。
@Configuration
class MetricsConfig {
    @Bean
    LoggingMeterRegistry loggingMeterRegistry() {
        return new LoggingMeterRegistry();
    }
}
现在,指标也显示在日志中:
2019-07-17 11:07:09.406  INFO 91283 --- [trics-publisher] i.m.c.i.logging.LoggingMeterRegistry     : jvm.buffer.count{id=direct} value=0 buffers
2019-07-17 11:07:09.406  INFO 91283 --- [trics-publisher] i.m.c.i.logging.LoggingMeterRegistry     : jvm.buffer.count{id=mapped} value=0 buffers
2019-07-17 11:07:09.406  INFO 91283 --- [trics-publisher] i.m.c.i.logging.LoggingMeterRegistry     : jvm.buffer.memory.used{id=direct} value=0 B
2019-07-17 11:07:09.406  INFO 91283 --- [trics-publisher] i.m.c.i.logging.LoggingMeterRegistry     : jvm.buffer.memory.used{id=mapped} value=0 B
2019-07-17 11:07:09.408  INFO 91283 --- [trics-publisher] i.m.c.i.logging.LoggingMeterRegistry     : jvm.classes.loaded{} value=8530 classes
2019-07-17 11:07:09.408  INFO 91283 --- [trics-publisher] i.m.c.i.logging.LoggingMeterRegistry     : jvm.gc.live.data.size{} value=0 B
2019-07-17 11:07:09.408  INFO 91283 --- [trics-publisher] i.m.c.i.logging.LoggingMeterRegistry     : jvm.gc.max.data.size{} value=0 B
2019-07-17 11:07:09.410  INFO 91283 --- [trics-publisher] i.m.c.i.logging.LoggingMeterRegistry     : jvm.memory.committed{area=nonheap,id=Compressed Class Space} value=6.25 MiB
2019-07-17 11:07:09.410  INFO 91283 --- [trics-publisher] i.m.c.i.logging.LoggingMeterRegistry     : jvm.memory.committed{area=heap,id=G1 Eden Space} value=168 MiB
...那么,如何提供这些指标呢?一个示例可能是 WebMvcMetricsFilter ,向所有 Spring Web MVC 端点添加性能指标 (http.server.requests metric) 。
但是这个例子很简单。当所有请求都由 Spring 框架处理时,在内部添加调用生成指标是没有必要的(只检查 WebMvcMetricsFilter.record() 方法)。
但是,如果您使用纯 ehcache 或 hibernate 或其他数据源,然后生成指标,情况又会如何呢?
那么 cache. * 指标呢,即使我 @Autowired 纯 net.sf.ehcache.Cache 也会生成?
那么 hibernate. * 指标呢,即使我 @Autowired 纯 org.hibernate.SessionFactory 也会生成?
然后, jvm. , process. , tomcat.* 等如何自动生成?
它似乎比人们想象的更简单,因为这些统计数据是由受监控的组件本身提供的。有时,它将直接提供,例如cache.getStatistics() 为 EhCache 提供 StatisticsGateway ,或 sessionFactory.getStatistics() 为 Hibernate SessionFactory 提供 statistics 等等。
有时,这可以通过其他方式实现,比如托管 bean 。例如,将 RuntimeMXBean 用于 JVM process. 指标以及 将(如GlobalRequestProcessor, Servlet 等) Tomcat mbeans 用于 tomcat. 指标
为了访问这些统计数据并将其转换为特定指标,Micrometer 引入了 MeterBinder 的概念。
检查 MeterBinder implementation 层次结构,您将了解更多关于可用的指标组的信息。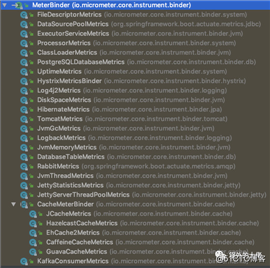
Micrometer MeterBinders
您也可以直接在 micrometer repo 上检查。
打开,例如, EhCache2Metrics ,您将找到 Ehcache 统计信息映射到特定 Micrometer 指标的内容和方式。
cache.size -> StatisticsGateway:getSize cache.gets{result=miss} -> StatisticsGateway:cacheMissCount cache.gets{result=hit} -> StatisticsGateway:cacheHitCount cache.puts -> StatisticsGateway:cachePutCount cache.evictions -> StatisticsGateway:cacheEvictedCount cache.remoteSize -> StatisticsGateway::getRemoteSize cache.removals -> StatisticsGateway::cacheRemoveCount cache.puts.added{result=added} -> StatisticsGateway::cachePutAddedCount cache.puts.added{result=updated} -> StatisticsGateway::cachePutAddedCount cache.misses{reason=expired} -> StatisticsGateway::cacheMissExpiredCount) cache.misses{reason=notFound} -> StatisticsGateway::cacheMissNotFoundCount) cache.xa.commits{result=readOnly} -> StatisticsGateway::xaCommitReadOnlyCount cache.xa.commits{result=exception} -> StatisticsGateway::xaCommitExceptionCount cache.xa.commits{result=committed} -> StatisticsGateway::xaCommitCommittedCount cache.xa.rollbacks{result=exception} -> StatisticsGateway::xaRollbackExceptionCount cache.xa.rollbacks{result=success} -> StatisticsGateway::xaRollbackSuccessCount cache.xa.recoveries{result=nothing} -> StatisticsGateway::xaRecoveryNothingCount cache.xa.recoveries{result=success} -> StatisticsGateway::xaRecoveryRecoveredCount cache.local.offheap.size -> StatisticsGateway::getLocalOffHeapSize) cache.local.heap.size -> StatisticsGateway::getLocalHeapSizeInBytes cache.local.disk.size -> StatisticsGateway::getLocalDiskSizeInBytes注册 MeterBinders 是非常简单的,示例可以在 micrometer 文档 中被找到。
记住,您可以手动操作:
new ClassLoaderMetrics().bindTo(registry);
new JvmMemoryMetrics().bindTo(registry);
new EhCache2Metrics(cache, Tags.of("name", cache.getName())).bindTo(registry)
new TomcatMetrics(manager, tags).bindTo(registry)
...
或者,您可以使用 Spring Boot ,它会在引擎下为您做这件事。
正如我之前提到的,actuator 将提供许多 AutoConfiguration s 和 MetricsBinders ,只要添加给定的依赖项,它就会注册 MeterBinders 。
例如, TomcatMetricsBinder 将注册 TomcatMetrics (为您的嵌入式容器)。MeterRegistryConfigurer 将注册 JVM 、运行时间 和其他系统指标。
现在,假设您想在您的应用程序中使用 Ehcache 。您可以添加两个依赖项:
implementation("org.springframework.boot:spring-boot-starter-cache")
implementation("net.sf.ehcache:ehcache")
然后注册缓存(您也可以通过 ehcache.xml 来实现)
  @Bean
    Cache playCache(EhCacheCacheManager cacheManager) {
        CacheConfiguration cacheConfiguration = new CacheConfiguration()
            .name(CACHE_NAME)
            .maxEntriesLocalHeap(MAX_ELEMENTS_IN_MEMORY);
        Cache cache = new Cache(cacheConfiguration);
        cacheManager.getCacheManager().addCache(cache);
        cacheManager.initializeCaches();
        return cache;
    }
现在, CacheMetricsRegistrarConfiguration 将通过 Spring 缓存管理器为每一个缓存管理注册 EhCache2Metrics 。
如果您不想使用 Spring 缓存管理,您也可以自己注册 EhCache2Metrics 。
现在,启动应用程序,您将看到其他 ehcache 指标。
2019-07-17 13:08:45.113  INFO 93052 --- [trics-publisher] i.m.c.i.logging.LoggingMeterRegistry     : cache.gets{cache=playCache,cacheManager=cacheManager,name=playCache,result=hit} throughput=12.95/s
2019-07-17 13:08:45.124  INFO 93052 --- [       Thread-4] i.m.c.i.logging.LoggingMeterRegistry     : cache.misses{cache=playCache,cacheManager=cacheManager,name=playCache,reason=notFound} throughput=3.7/s
2019-07-17 13:08:45.124  INFO 93052 --- [trics-publisher] i.m.c.i.logging.LoggingMeterRegistry     : cache.gets{cache=playCache,cacheManager=cacheManager,name=playCache,result=miss} throughput=3.7/s
2019-07-17 13:08:48.840  INFO 93052 --- [       Thread-4] i.m.c.i.logging.LoggingMeterRegistry     : cache.puts{cache=playCache,cacheManager=cacheManager,name=playCache} throughput=16.65/s
2019-07-17 13:08:48.840  INFO 93052 --- [trics-publisher] i.m.c.i.logging.LoggingMeterRegistry     : cache.misses{cache=playCache,cacheManager=cacheManager,name=playCache,reason=notFound} throughput=3.7/s
2019-07-17 13:08:48.841  INFO 93052 --- [trics-publisher] i.m.c.i.logging.LoggingMeterRegistry     : cache.puts{cache=playCache,cacheManager=cacheManager,name=playCache} throughput=16.65/s
2019-07-17 13:08:48.841  INFO 93052 --- [       Thread-4] i.m.c.i.logging.LoggingMeterRegistry     : cache.puts.added{cache=playCache,cacheManager=cacheManager,name=playCache,result=updated} throughput=0.116667/s
2019-07-17 13:08:48.841  INFO 93052 --- [trics-publisher] i.m.c.i.logging.LoggingMeterRegistry     : cache.puts.added{cache=playCache,cacheManager=cacheManager,name=playCache,result=updated} throughput=0.116667/s
2019-07-17 13:08:48.841  INFO 93052 --- [       Thread-4] i.m.c.i.logging.LoggingMeterRegistry     : cache.puts.added{cache=playCache,cacheManager=cacheManager,name=playCache,result=added} throughput=0.116667/s
2019-07-17 13:08:48.842  INFO 93052 --- [trics-publisher] i.m.c.i.logging.LoggingMeterRegistry     : cache.puts.added{cache=playCache,cacheManager=cacheManager,name=playCache,result=added} throughput=0.116667/s
2019-07-17 13:08:48.847  INFO 93052 --- [trics-publisher] i.m.c.i.logging.LoggingMeterRegistry     : cache.local.disk.size{cache=playCache,cacheManager=cacheManager,name=playCache} value=0 B
2019-07-17 13:08:48.847  INFO 93052 --- [       Thread-4] i.m.c.i.logging.LoggingMeterRegistry     : cache.local.disk.size{cache=playCache,cacheManager=cacheManager,name=playCache} value=0 B
2019-07-17 13:08:48.908  INFO 93052 --- [       Thread-4] i.m.c.i.logging.LoggingMeterRegistry     : cache.local.heap.size{cache=playCache,cacheManager=cacheManager,name=playCache} value=1.039062 KiB
2019-07-17 13:08:48.908  INFO 93052 --- [trics-publisher] i.m.c.i.logging.LoggingMeterRegistry     : cache.local.heap.size{cache=playCache,cacheManager=cacheManager,name=playCache} value=1.039062 KiB
2019-07-17 13:08:48.909  INFO 93052 --- [trics-publisher] i.m.c.i.logging.LoggingMeterRegistry     : cache.local.offheap.size{cache=playCache,cacheManager=cacheManager,name=playCache} value=0 B
2019-07-17 13:08:48.909  INFO 93052 --- [       Thread-4] i.m.c.i.logging.LoggingMeterRegistry     : cache.local.offheap.size{cache=playCache,cacheManager=cacheManager,name=playCache} value=0 B
2019-07-17 13:08:48.909  INFO 93052 --- [       Thread-4] i.m.c.i.logging.LoggingMeterRegistry     : cache.remoteSize{} value=0
2019-07-17 13:08:48.909  INFO 93052 --- [trics-publisher] i.m.c.i.logging.LoggingMeterRegistry     : cache.remoteSize{} value=0
2019-07-17 13:08:48.909  INFO 93052 --- [       Thread-4] i.m.c.i.logging.LoggingMeterRegistry     : cache.size{cache=playCache,cacheManager=cacheManager,name=playCache} value=7
2019-07-17 13:08:48.909  INFO 93052 --- [trics-publisher] i.m.c.i.logging.LoggingMeterRegistry     : cache.size{cache=playCache,cacheManager=cacheManager,name=playCache} value=7
在这种情况下,指标上下文中每个组件的职责可归纳为: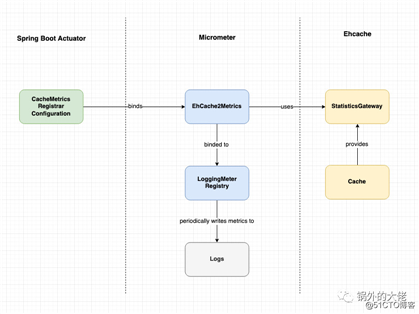
Ehcache 指标架构
您可以在 此处 提供的示例应用中查看所有这些概念。
8月福利来袭!关注公众号
后台回复:003 ,领取7月翻译集锦~
往期福利回复:001, 002即可领取
●Java Hashing:从重写HashCode到可变对象
●Spring WebClient vs. RestTemplate
●使用 Spring Framework 时常犯的十大错误
右上角按钮分享给更多人哦~
标签:点击 统计 sre 数据源 proc rollback figure 转换 base
原文地址:https://blog.51cto.com/14901350/2524089