标签:style blog http io color ar os sp java
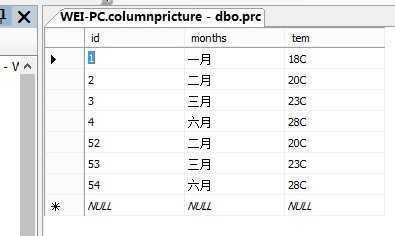
乱搞了个数据库 后面发现没定INT类型 直接将ID当数据显示了
效果图:
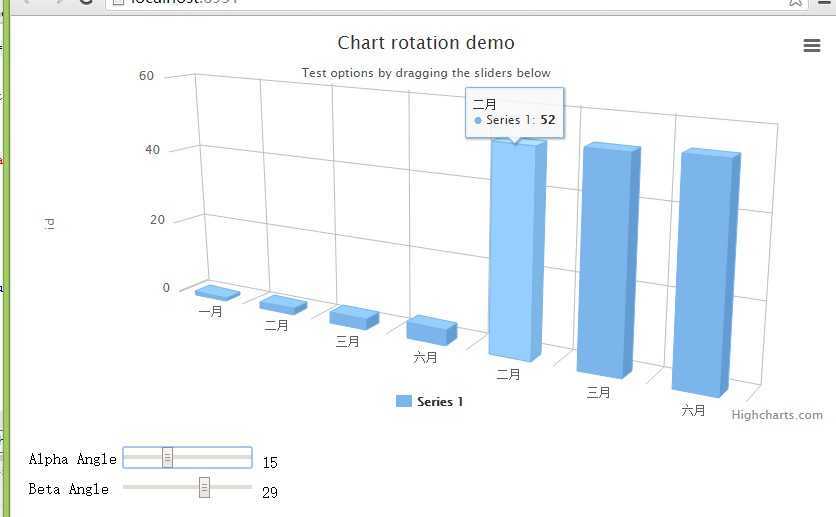
前端

  1 @{
  2     Layout = null;
  3 }
  4
  5 <!DOCTYPE html>
  6
  7 <html>
  8 <head>
  9     <meta name="viewport" content="width=device-width" />
 10
 11     <script src="~/Scripts/jquery-1.7.1.js"></script>
 12     <script src="~/Scripts/Highcharts-4.0.3/js/highcharts.js"></script>
 13     <script src="~/Scripts/Highcharts-4.0.3/js/modules/exporting.js"></script>
 14     <script src="~/Scripts/Highcharts-4.0.3/js/highcharts-3d.js"></script>
 15     <script type="text/javascript">
 16
 17         $(function () {
 18
 19             var values = "";
 20             var data1 = [];
 21             var months = [];
 22             //var a = [29.9, 71.5, 106.4, 129.2, 144]
 23             $.ajax({
 24                 url: ‘../Home/se‘,
 25                 type: ‘post‘,
 26                 dataType: "json",
 27
 28                 success: function (msg) {
 29                     //var values = JSON.stringify(msg)
 30                     //alert(msg.length)
 31                     for (var i = 0; i < msg.length; i++) {
 32                         //alert("123")
 33                         //values += "11" + msg[i].tem + "11"
 34                         //var a= values.push(bb[i].tem);
 35                         data1.push(msg[i].id)
 36                         months.push(msg[i].months)
 37                     }
 38
 39                     var chart = new Highcharts.Chart({
 40                         chart: {
 41                             renderTo: ‘container‘,
 42                             type: ‘column‘,
 43                             margin: 75,
 44                             options3d: {
 45                                 enabled: true,
 46                                 alpha: 15,
 47                                 beta: 15,
 48                                 depth: 50,
 49                                 viewDistance: 25
 50                             }
 51                         },
 52                         title: {
 53                             text: ‘Chart rotation demo‘
 54                         },
 55                         xAxis: {
 56                             categories:months
 57
 58                         },
 59                         yAxis: {
 60                             min: 0,
 61                             title: {
 62                                 text: ‘id‘
 63                             }
 64                         },
 65                         subtitle: {
 66                             text: ‘Test options by dragging the sliders below‘
 67                         },
 68                         plotOptions: {
 69                             column: {
 70                                 depth: 25
 71                             }
 72                         },
 73                         series: [{
 74                             data:data1
 75                         }]
 76                     });
 77                     // Activate the sliders
 78                     $(‘#R0‘).on(‘change‘, function () {
 79                         chart.options.chart.options3d.alpha = this.value;
 80                         showValues();
 81                         chart.redraw(false);
 82                     });
 83                     $(‘#R1‘).on(‘change‘, function () {
 84                         chart.options.chart.options3d.beta = this.value;
 85                         showValues();
 86                         chart.redraw(false);
 87                     });
 88                     function showValues() {
 89                         $(‘#R0-value‘).html(chart.options.chart.options3d.alpha);
 90                         $(‘#R1-value‘).html(chart.options.chart.options3d.beta);
 91                     }
 92                     showValues();
 93                 }
 94             })
 95
 96
 97
 98
 99
100
101
102         });
103     </script>
104     <title>Index</title>
105 </head>
106 <body>
107     <div id="container" style="min-width: 700px; height: 400px"></div>
108
109     <div id="sliders" style="min-width: 310px; max-width: 800px; margin: 0 auto;">
110         <table>
111             <tr>
112                 <td>Alpha Angle</td>
113                 <td>
114                     <input id="R0" type="range" min="0" max="45" value="15" />
115                     <span id="R0-value" class="value"></span></td>
116             </tr>
117             <tr>
118                 <td>Beta Angle</td>
119                 <td>
120                     <input id="R1" type="range" min="0" max="45" value="15" />
121                     <span id="R1-value" class="value"></span></td>
122             </tr>
123         </table>
124     </div>
125 </body>
126 </html>
后台
 1 using System;
 2 using System.Collections.Generic;
 3 using System.Linq;
 4 using System.Web;
 5 using System.Web.Mvc;
 6 using 表格.Models;
 7
 8 namespace 表格.Controllers
 9 {
10     public class HomeController : Controller
11     {
12         //
13         // GET: /Home/
14         columnprictureEntities db = new columnprictureEntities();
15         public ActionResult Index()
16         {
17             return View();
18         }
19         public ActionResult se()
20         {
21
22
23
24             var d = (from b in db.prc select b).ToList();
25             List<Models.prc> bb = (from dd in db.prc select dd).ToList();
26             return Json(d, JsonRequestBehavior.AllowGet);
27         }
28
29     }
30 }
无聊写了一个最简单的MVC4+Highcharts连数据库例子
标签:style blog http io color ar os sp java
原文地址:http://www.cnblogs.com/weivvei/p/4095343.html
