标签:
画一个量随着时间变化的曲线是经常会遇到的需求,比如画软件用户数的变化曲线。画随时间变化的曲线主要用到的函数是matplotlib.pyplot.plot_date(date,num)。由于其第一个变量是datetime类型的,所以对于string类型的数据输入,首先需要进行格式化操作。
time=datetime.datetime.strptime(‘2014-12-28 13:49:30‘,‘%Y-%m-%d %H:%M:%S‘)
print time
2014-12-28 13:49:30
常见的对应关系如下表所示(2014-12-28 13:49:30),更多可以参见python对时间日期做格式化 - 走到天亮 - 博客园
|
Year |
Month |
Day |
Hour |
Minute |
Second |
|||
|
%y |
%Y |
%m |
%b |
%d |
%H |
%I |
%M |
%S |
|
14 |
2014 |
12 |
Dec |
28 |
13 |
01 |
49 |
30 |
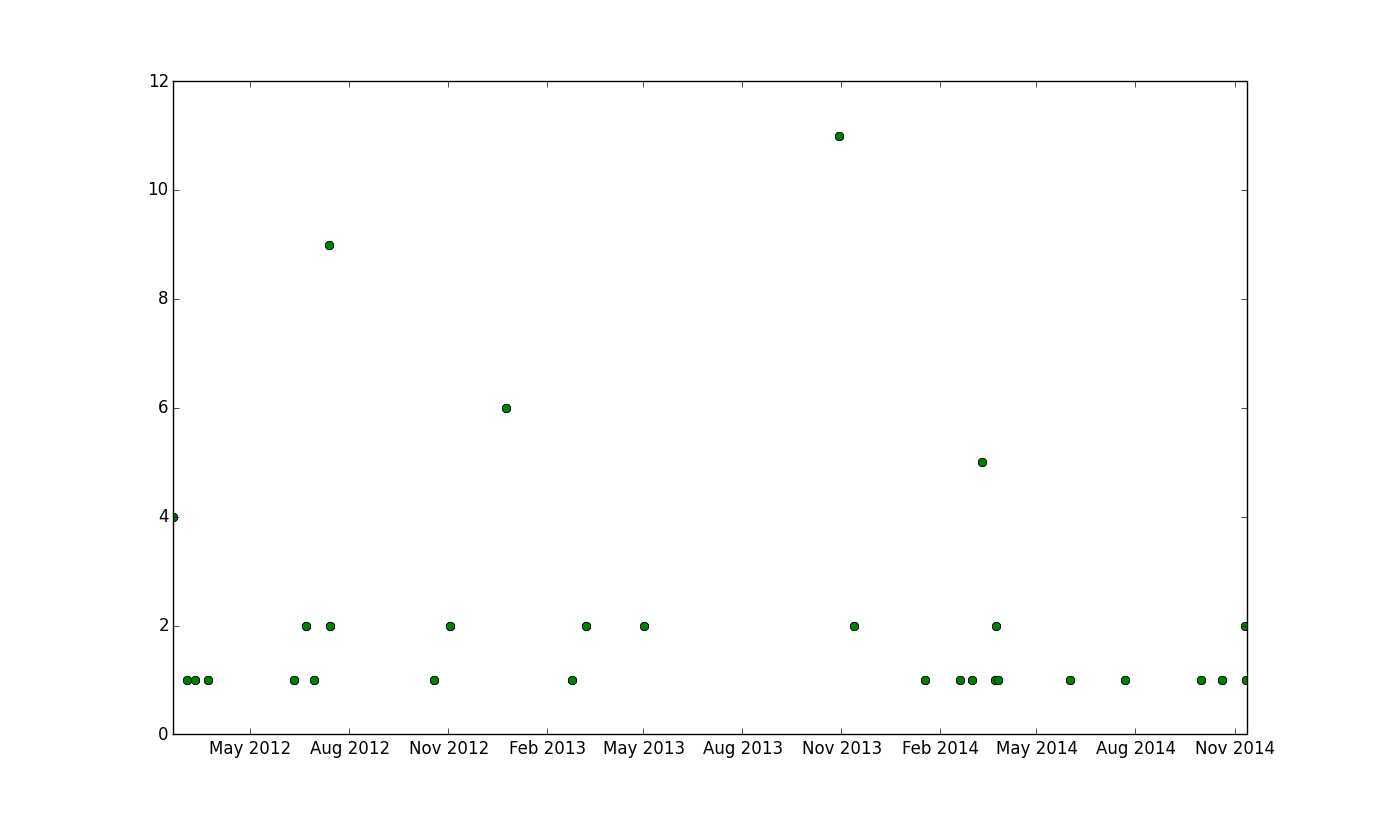
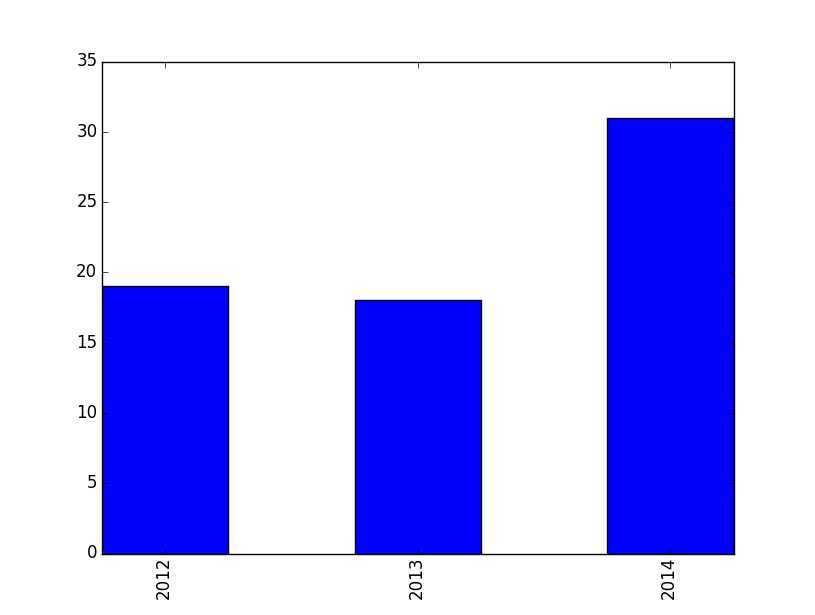
统计windows下软件首次安装的数目并画出散点图(按日统计)和柱状图(按年统计)
import _winreg
import datetime
import matplotlib.dates
import matplotlib.pyplot
import numpy as np
print "import winreg done!"

key = _winreg.OpenKey(_winreg.HKEY_LOCAL_MACHINE,r"Software\Microsoft\Windows\CurrentVersion\Uninstall")
#key = _winreg.OpenKey(_winreg.HKEY_CURRENT_USER,r"Software\Microsoft\Windows\CurrentVersion\Explorer")
print key
all_software=[]
k=0
try:
    i=0
    while 1:
        subkey_string=_winreg.EnumKey(key,i)
        #print subkey_string
        try:
            j=0
            temp={}
            get_installDate=0
            #some subkey may not have installdate subkey and value
            while 1:
                #subkey=_winreg.OpenKey(key,"InstallDate")
                subkey=_winreg.OpenKey(key,subkey_string)
                name, value, type_value = _winreg.EnumValue(subkey,j)
                #print repr(name),repr(value)
                #print "name is "+name
                if name=="DisplayName":
                    #print "Name equals DisplayName"
                    temp["DisplayName"]=value
                if name=="InstallDate":
                    #print "Name equals installdate"
                    temp["InstallDate"]=value
                    get_installDate=1
                j+=1
        except WindowsError:
            #print ‘interruptted j=‘+str(j)
            if get_installDate:
                all_software.append(temp)
        #print repr(name)
        #print value
        i +=1
except WindowsError:
    print
for item in range(len(all_software)):
    all_software[item]["InstallDate"]=datetime.datetime.strptime(all_software[item]["InstallDate"].encode(‘ascii‘,‘ignore‘),‘%Y%m%d‘)
count={}
bar_by_year={}
bar_by_year[‘2012‘]=0
bar_by_year[‘2013‘]=0
bar_by_year[‘2014‘]=0
for item in all_software:
    if count.has_key(item["InstallDate"]):
        count[item["InstallDate"]]+=1
    else:
        count[item["InstallDate"]]=1
    bar_by_year[str(item[‘InstallDate‘].year)]+=1
xvalues=[]
yvalues=[]
for key,value in count.iteritems():
    xvalues.append(key)
    yvalues.append(value)
xvalues=matplotlib.dates.date2num(xvalues)
matplotlib.pyplot.figure(1)
matplotlib.pyplot.plot_date(xvalues,yvalues)
matplotlib.pyplot.figure(2)
xvalues_2=np.arange(3)
yvalues_2=bar_by_year.values()
fig2=matplotlib.pyplot.bar(xvalues_2,yvalues_2,0.5)
matplotlib.pyplot.xticks(xvalues_2+0.25, [‘2012‘,‘2013‘,‘2014‘], rotation=‘vertical‘)
matplotlib.pyplot.show()

#value, type = _winreg.QueryValueEx(key, "EnableAutoTray")
[2]c++ - How can I enumerate/list all installed applications in Windows XP? - Stack Overflow
[3]winreg – Windows registry access — Python v3.0.1 documentation
[4]graph - plotting time in python with matplotlib - Stack Overflow
[6]Python图表绘制:matplotlib绘图库入门 - 蝶梦庄周 - 博客园
[7]ticks_and_spines example code: ticklabels_demo_rotation.py — Matplotlib 1.4.2 documentation
[8]api example code: barchart_demo.py — Matplotlib 1.4.2 documentation
标签:
原文地址:http://www.cnblogs.com/jiangz/p/4189835.html