标签:
Woo-hoo! Now you know what is happening with your app’s memory usage when you see one of those OOM exception. But, you don’t know where to find the source. Let alone, how to fix it.
Tracking down memory issues can be a pain in the neck. Here are a few strategies that will help you as you pursue the noble craft of Android-igami.
Sample project
There are code snippets and screenshots of what I’m working on sprinkled throughout this post. These will come from a single sample project, and if you prefer to see things in their entirety before being divided into little pieces, I provided that sample project to download here.
For those keeping score at home, this project has one A-level memory leak: the type of leak that no developer should ever allow into their code. And I’m not going to tell you where it is. But, that’s the purpose of this experiment! So let’s take a look at where it goes wrong.
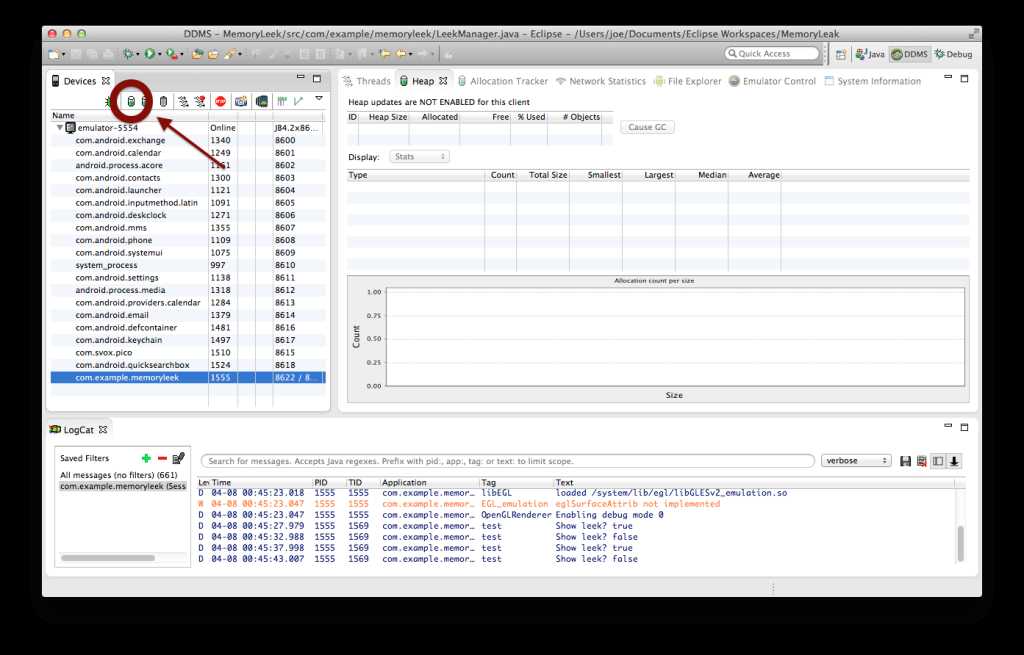
Window->Open Perspective->Other popup dialog).adb).This will put some numbers in that chart. The one we should focus on is “Allocated,” which shows you how much memory the Dalvik VM currently has given your app. This can stretch and shrink a bit, but there’s an upper limit (the size of which depends on the device). If you exceed the upper limit, you pop out an OOM and the app crashes.
This is a great tool to keep an eye on while you develop, since it shows a live snapshot of the system after any garbage collection cycle. If you ever notice the allocated memory gradually increasing without ever letting anything go, that’s a good indication that you might have a memory leak.3
There are some acronyms for you, huh?
“MAT,” the Eclipse Memory Analyzer tool, can read a file that your virtual machine generates (Remember that one we talked about in the last post? It’s called Dalvik). That file, called a “heap dump,” represents the set of all objects currently stored on your process’s heap4. That means you can actually poke around the metadata of the objects you’re using during runtime.
What you’ll need:
.hprof file.Run the MemoryLeek project on an emulator5. You should see a white screen with a slowly blinking image. Rotate the emulator ten or so times (either 7 on the numpad or Cntrl+F12). Now, return to Eclipse, and open the DDMS perspective once again. This time, we’re aiming for the green disc icon with an arrow attached — indicating you want to generate a heap dump. Go ahead and click it, and you should see a statement in the Android log that looks like:
|
1
|
I/dalvikvm(1948): hprof: dumping heap strings to "[DDMS]".
|
That’s good. Now leave it for a bit, because it could take a couple of minutes to generate (and the emulator is frozen until it finishes).
Once the output is ready, it should prompt you about some different types of reports. (If you instead see a prompt to save a file, go ahead and save it somewhere, then use the SDK tool hprof-conv to convert it to the appropriate format, and manually open it with Eclipse’s MAT). Once you have the “reports” prompt, just cancel out of it — we’re not going to use any pre-set reports for this.
Hooray! If you’re reading this, you’re hopefully looking at some kind of graph of your app’s current memory state. In my case, a pie chart.
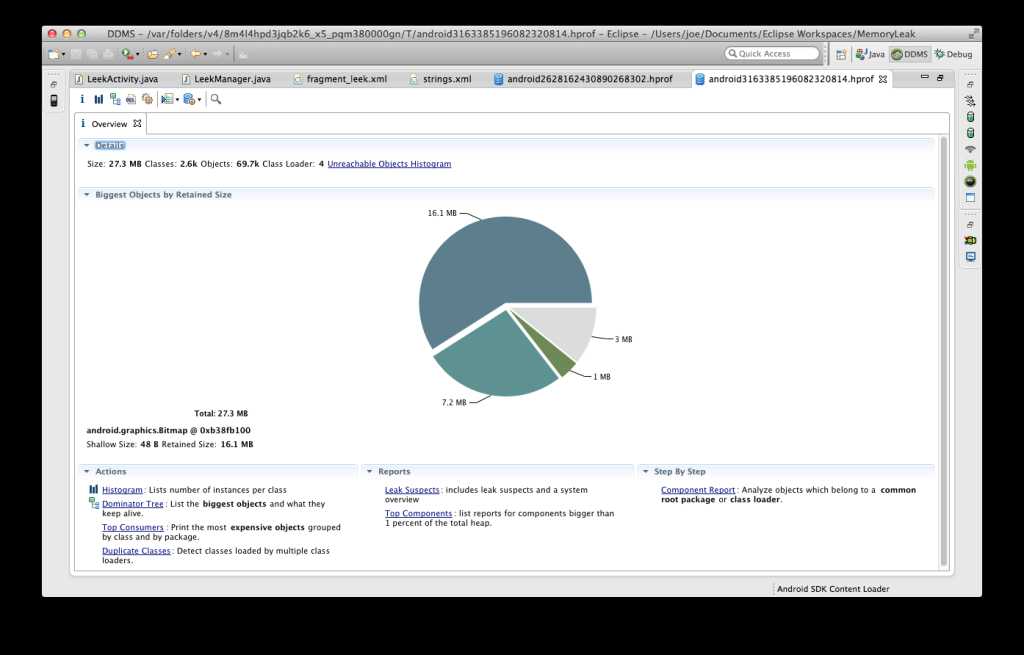
Let’s try poking around a bit. Click the little bar chart icon in the top left, that says “Create a histogram…” when you hover over it. This will show you a list of all the objects currently allocated, in no particular order.
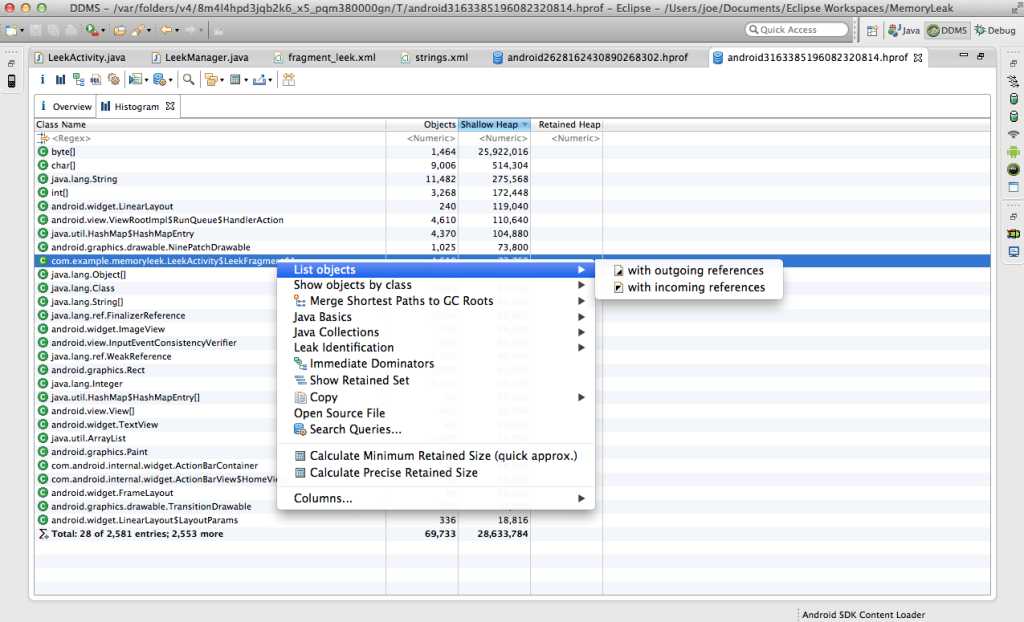
You’re looking at the name and package of the objects in the first column, the number of that kind of object in existence at the moment in the next column and then some representation of the total heap sizes in the third and fourth columns6.
It might be interesting to sort by size or count to see where the majority of memory is being used in your code7. If you right-click on one of these listings, you can get some cool options, like all instances of objects of that type with all the references that keep it from being garbage collected.
But wait, we’re supposed to be hunting for something, right? We need a target of some kind.
There’s a lot of noise in an app’s memory space. Fortunately, we can narrow it down in a few ways.
First, try applying filtering to this list. In the first row, you can enter text. Since you almost always want to take a closer look at your code, I suggest entering something like “com.example.memoryleek”. This should filter down to a handful of entries.
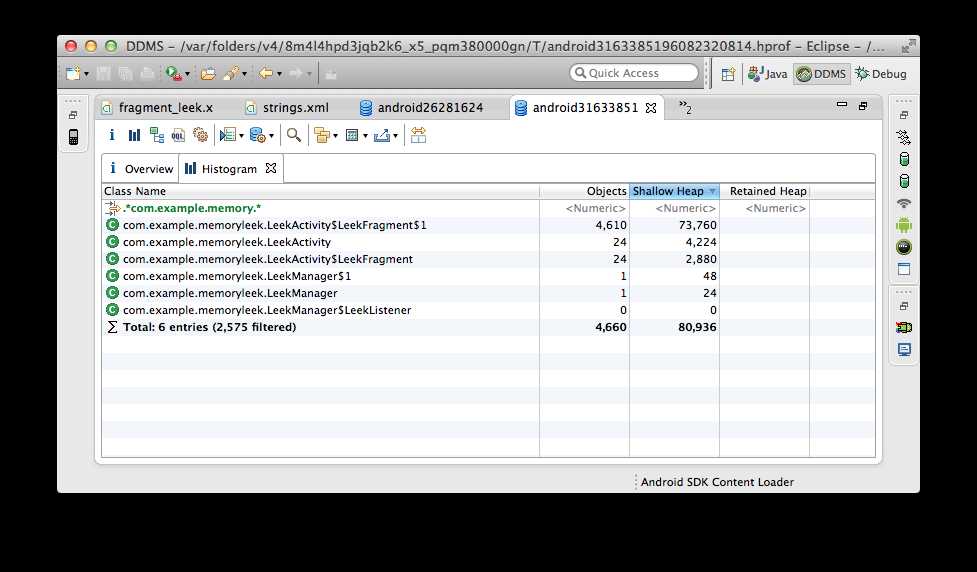
Gazing upon these, I’m hoping you notice something horrifying. If you don’t, I recommend taking another look at Part 1 of this series. Hopefully you will figure out what the worst thing in the world to leak would be.
Hint: it’s Activities.
And, good Lord, I have 24 instances of LeekActivity right now! That’s totally not OK.
Why might this be?
Well, kindly, MAT has a way to tell us. You can right-click that list item, and select “Merge Shortest Paths to GC Roots”, excluding WeakReferences (remember, WeakReferences will have no effect on what is retained). This means we want to see what memory root all these objects have in common. That should indicate if there’s something retaining all of them at once, ergo, a leak of some kind!
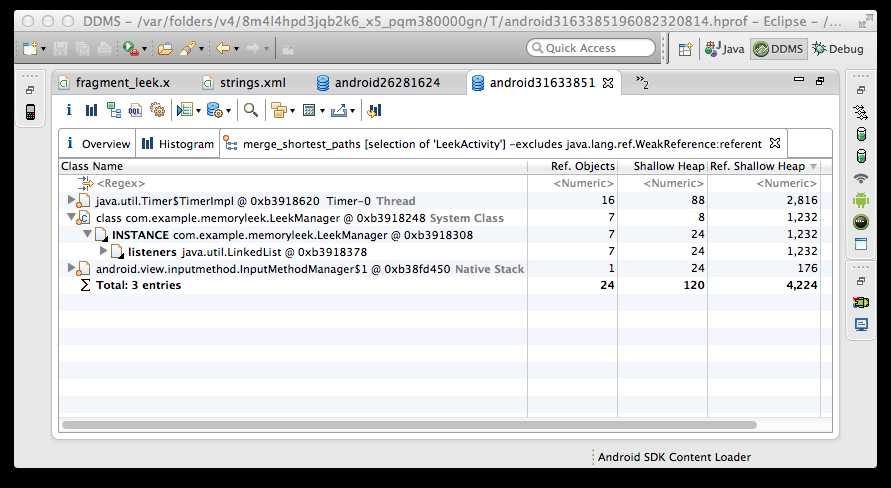
In this case, there are 3 roots. Two of them are external to this project, so aren’t likely culprits. But, that LeekManager instance looks suspicious….
A-Ha! If you open it up, you can see that there’s a LinkedList called “listeners” on LeekManager that has a reference to all of those Activities.
But, where did that come from?
Well, check this out:
// In LeekFragment.class:

@Override
public void onCreate(Bundle savedInstanceState) {
    super.onCreate(savedInstanceState);

    // Add this fragment as a leek listener so
    // it can update its view accordingly
    LeekManager.get().addListener(this);
}
Every time our LeekFragment is created, we add it as a LeekListener to the LeekManager singleton. But, when we did those rotations, the Fragment was never removed as a listener. The Fragment has a reference to the parent Activity, and the parent LeekActivity has references to all the other view elements.
There’s our leak. Fixing it? Easy: LeekFragment needs to be removed from LeekManager upon its onDestroy() lifecycle method.
Now, the above code looks like:
// In LeekFragment.class:

@Override
public void onCreate(Bundle savedInstanceState) {
    super.onCreate(savedInstanceState);

    // Add this fragment as a leek listener so
    // it can update its view accordingly
    LeekManager.get().addListener(this);
}

@Override
public void onDestroy() {
    super.onDestroy();

    LeekManager.get().removeListener(this);
}
And when we run the app, we don’t see any more indications of leaky memory! Hoorah!
HUNTING YOUR LEAKS: MEMORY MANAGEMENT IN ANDROID (PART 2 OF 2)
标签:
原文地址:http://www.cnblogs.com/youye/p/4323237.html