标签:c style class blog code java
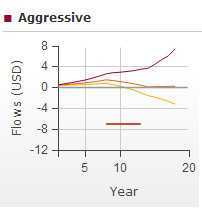
Sencha出品的ExtJs是一个非常优秀的前端框架,尤其是具有里程碑意义的4.0的发布。4.0采用MVC架构和全新的class系统,并且提供了非常丰富的组件。但是,尽管ExtJS如此强大,仍有不尽人意的地方。比如,chart里坐标轴的刻度通常是均匀分布的,ExtJS的实现也是通过坐标轴的最大值和最小值以及其他参数配置均匀的计算刻度。但是,在工作过程中碰到需要自定义刻度的情况,如下图所示

水平轴的刻度是5,10,20这样的不均匀值,但是ExtJS不支持这样的功能(至少我翻遍了文档也没找到)。最初想到的办法是隐藏不需要的label,可这样写:
 1 {
 2     type: ‘Numeric‘,
 3     position: ‘bottom‘,
 4     fields: [‘x‘],
 5     title: xAxisTitle,
 6     minimum: xRange.xMinimum,
 7     maximum: xRange.xMaximum,
 8     majorTickSteps: 5,
 9     minorTickSteps: 10,
10     label: {
11         renderer: function(val) {
12             //lables: [5, 10, 20]
13             if (labels.indexOf(val) < 0) {
14                 return ‘‘;
15             }
16             return val;
17         }
18     },
19     grid: true
20 }
但是这样写有两个问题,一是需要显示的label值不一定会出现在renderer中,二是即便label没显示,垂直的网格线(通过配置代码中红色部分的属性可以调节网格线密度)还是会出现,这可能并不是我们想要的。通过查阅源码发现,在坐标轴内部实现中,是通过坐标轴范围和刻度个数来计算的,并且网格线跟坐标刻度是一致的。在源码文件ext\src\chart\axis\Axis.js 480行:
1 // Build the array of steps out of the fixed-value ‘step‘.
2        steps = new Array;
3        for (val = +me.from; val < +me.to; val += step) {
4             steps.push(val);
5        }
6        steps.push(+me.to);
之后渲染label和网格线都用到steps这个数组。所以,可以在这个地方做点手脚,把steps变量强行改成我们需要的数组,让ExtJS按照我们的意图去做。显然,不能直接去修改Ext的源码文件。这里有两种办法,一是用Ext.override方法去重写Ext.chart.axis.Axis的drawAxis方法,二是在Axis的配置参数里提供该方法的自定义实现。前者会影响到之后的所有用到坐标轴的chart,后者只会影响当前的chart. 代码改动如下:
 1 Ext.syncRequire(‘Ext.chart.axis.Axis‘);
 2 Ext.override(Ext.chart.axis.Axis, {
 3     /**
 4      * Renders the axis into the screen and updates its position.
 5      */
 6     drawAxis: function(init) {
 7         var me = this,
 8             i,
 9             x = me.x,
10             y = me.y,
11             dashSize = me.dashSize,
12             length = me.length,
13             position = me.position,
14             verticalAxis = (position == ‘left‘ || position == ‘right‘),
15             inflections = [],
16             calcLabels = (me.isNumericAxis),
17             stepCalcs = me.applyData(),
18             step = stepCalcs.step,
19             steps = stepCalcs.steps,
20             stepsArray = Ext.isArray(steps),
21             from = stepCalcs.from,
22             to = stepCalcs.to,
23             // If we have a single item, to - from will be 0.
24             axisRange = (to - from) || 1,
25             trueLength,
26             currentX,
27             currentY,
28             path,
29             subDashesX = me.minorTickSteps || 0,
30             subDashesY = me.minorTickSteps || 0,
31             dashesX = Math.max(subDashesX + 1, 0),
32             dashesY = Math.max(subDashesY + 1, 0),
33             dashDirection = (position == ‘left‘ || position == ‘top‘ ? -1 : 1),
34             dashLength = dashSize * dashDirection,
35             series = me.chart.series.items,
36             firstSeries = series[0],
37             gutters = firstSeries ? firstSeries.nullGutters : me.nullGutters,
38             padding,
39             subDashes,
40             subDashValue,
41             delta = 0,
42             stepCount = 0,
43             tick, axes, ln, val, begin, end;
44
45         me.from = from;
46         me.to = to;
47
48         // If there is nothing to show, then leave.
49         if (me.hidden || (from > to)) {
50             return;
51         }
52
53         // If no steps are specified (for instance if the store is empty), then leave.
54         if ((stepsArray && (steps.length == 0)) || (!stepsArray && isNaN(step))) {
55             return;
56         }
57
58         if (stepsArray) {
59             // Clean the array of steps:
60             // First remove the steps that are out of bounds.
61             steps = Ext.Array.filter(steps, function(elem, index, array) {
62                 return (+elem > +me.from && +elem < +me.to);
63             }, this);
64
65             // Then add bounds on each side.
66             steps = Ext.Array.union([me.from], steps, [me.to]);
67         } else {
68             // Build the array of steps out of the fixed-value ‘step‘.
69             steps = new Array;
70             if (me.fixedSteps) {
71                 steps = me.fixedSteps;
72             } else {
73                 for (val = +me.from; val < +me.to; val += step) {
74                     steps.push(val);
75                 }
76                 steps.push(+me.to);
77             }
78
79         }
80         ...//此处省略其他原有代码
81     }
82 });
代码中红色部分if语句块里就是偷梁换柱的地方。使用的时候,在axis的配置代码里加上fixedSteps属性就行了。
 1 {
 2     type: ‘Numeric‘,
 3     position: ‘bottom‘,
 4     fields: [‘x‘],
 5     title: xAxisTitle,
 6     minimum: xRange.xMinimum,
 7     maximum: xRange.xMaximum,
 8     fixedSteps: [5, 10,20],
 9     grid: true
10 }
至此,雕虫小技大功告成。欢迎拍砖。
Extjs 4 chart自定义坐标轴刻度,布布扣,bubuko.com
标签:c style class blog code java
原文地址:http://www.cnblogs.com/lzkwin/p/extjs4_custom_axis_scale.html