标签:
网址:
http://www.hcharts.cn/demo/index.php
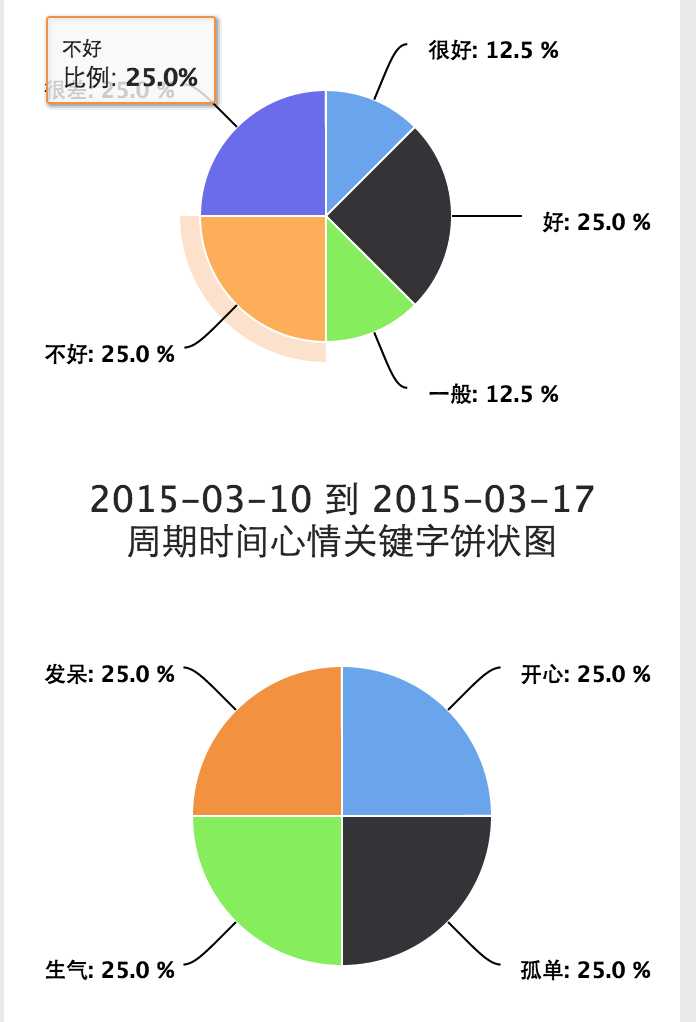
效果图:
它的网址里面都很全的。简单实用扣代码即可
使用时注意数据格式即可
 1         //获取mood_evalue的百分比
 2             $total_mood_evalue         = 0;
 3             //初始化key的数组,统计key的百分比
 4             $mood_key_arr             = array();
 5
 6             //1-5分别对应值1-5;
 7             $mood_evalue_1            = $mood_evalue_2 = $mood_evalue_3 = $mood_evalue_4 = $mood_evalue_5 = 0;
 8             foreach ($info as $key => $value) {
 9                 $total_mood_evalue++;
10                 switch ($value[‘mood_evalue‘]) {
11                     case 1:
12                         $mood_evalue_1++;
13                         $info[$key][‘mood_evalue_str‘]     = ‘很好‘;
14                         break;
15                     case 2:
16                         $mood_evalue_2++;
17                         $info[$key][‘mood_evalue_str‘]     = ‘好‘;
18                         break;
19                     case 3:
20                         $mood_evalue_3++;
21                         $info[$key][‘mood_evalue_str‘]     = ‘一般‘;
22                         break;
23                     case 4:
24                         $mood_evalue_4++;
25                         $info[$key][‘mood_evalue_str‘]     = ‘不好‘;
26                         break;
27                     case 5:
28                         $mood_evalue_5++;
29                         $info[$key][‘mood_evalue_str‘]     = ‘很差‘;
30                         break;
31                     default:
32                         break;
33                 }
34                 $mood_key_arr[]     = $value[‘mood_key‘];
35             }
36             $mood_evalue_percent     = array(
37                                                 array(‘很好‘,round($mood_evalue_1 / $total_mood_evalue * 100,2)),
38                                                 array(‘好‘,round($mood_evalue_2 / $total_mood_evalue * 100,2)),
39                                                 array(‘一般‘,round($mood_evalue_3 / $total_mood_evalue * 100,2)),
40                                                 array(‘不好‘,round($mood_evalue_4 / $total_mood_evalue * 100,2)),
41                                                 array(‘很差‘,round($mood_evalue_5 / $total_mood_evalue * 100,2)),
42                                             );
将值json处理即可,或者使用js来格式化数据
补充:
Highcharts 跟 Highstock 效果不一样。使用方法大体一致
自己简单总结的,不一定对
 1 chart
 2     type :     ‘line‘  曲线图,
 3             ‘area‘ 区域图,
 4             ‘areaspline‘ 曲线区域图
 5             ‘arearange‘  区域范围图
 6             ‘column‘     柱形图
 7             ‘bar‘     条形图
 8             ‘pie‘    饼图,饼图跟其他的不一样,不仅仅指定type。
 9     inverted: 是否反转x,y轴;(true,false)
10
11 title
12     text : ‘主标题文字‘
13     x:文字定位x,
14     y:文字定位y轴,
15
16 subtitle
17     text : ‘副标题文字‘
18     x:文字定位x,
19     y:文字定位y轴,
20
21 legend(对说明的配置,即蓝色线图代表的文字意义之类的)
22     layout : ‘vertical‘ 表示垂直放置,不设置即水平的
23     align : 水平位置
24     verticalAlign: 垂直位置
25     x: 定位x
26     y: 定位y
27     floating: 是否浮动,true表示真,false表示不浮动
28     borderWidth: 边框宽度,数字
29     backgroundColor: 背景色
30
31 xAxis
32     title {
33         text: ‘x轴说明文字‘
34     },
35     min 如果是数值,那么最小值
36     max 如果是数值,那么最大值
37     categories 自定义x轴值,是个数组
38
39 yAxis (y轴的数据,是根据series下的data来自动填充的,如果需要格式化显示,labels--formatter)
40     title {
41         text: ‘y轴说明文字‘
42     },
43     plotLines [//y轴自定义绘制线条,每个值都是一个对象
44         {
45         value 对应y轴数据,即定义线条的位置
46         width 线条宽度
47         color 颜色
48         }
49     ],
50     labels:{
51         formatter:function() {//格式化显示数据,除了value变量外,还有axis(对象)、chart(对象)、isFirst(boolean)、isLast(boolean)可用
52             return this.value  + 跟对应的操作,this.value 对应个就是y轴的值
53         },
54         enabled: true表示展示该轴,false表示不展示
55         step:显示间隔,假如数值为1,2,3,4,5 ,设置为2只展示1,3,5
56         staggerLines:水平轴Lables显示行数。(该属性只对水平轴有效)当Lables内容过多时,可以通过该属性控制显示的行数。和该属性相关的还有maxStaggerLines属性。
57     }
58
59
60
61 tooltip:(对提示的配置,即鼠标悬浮时的提示)
62     crosshairs: 曲线图,显示竖条 (true,false)
63     valueSuffix: 添加后缀标识符
64     shared: true 展示对应列所有的数据,false 单单展示鼠标放置点的数据
65
66     headerFormat: 指定html文档的开始
67     pointFormat: 指定html中间信息
68     footerFormat: 指定html格式的结尾
69     userHTML: 是否开启html格式解析
70
71 series:值是个数组,数组里面一个值是个对象
72 [
73     {
74         name: ‘‘, 数据的展示名称
75         data: [], 数据的值//null 表示没有,0表示0,不一样
76     },
77     {}
78 ]
在项目中使用(备):
  1 $.extend({
  2     table_png : function(res) {//曲线图图通用
  3         Highcharts.setOptions({
  4             global: {
  5                 useUTC: false //关闭文件默认时区,采用数据时间显示
  6             }
  7         });
  8         res._this.highcharts(‘StockChart‘, {
  9             title : {
 10                 text : res.title
 11             },
 12             credits : {
 13                 enabled : false,
 14             },
 15             exporting: {
 16                 enabled : false,
 17             },
 18             rangeSelector: {
 19                 buttons : [
 20                     {
 21                         type: ‘week‘,
 22                         count: 1,
 23                         text: ‘一星期‘
 24                     }, {
 25                         type: ‘month‘,
 26                         count: 1,
 27                         text: ‘一个月‘
 28                     }, {
 29                         type: ‘month‘,
 30                         count: 6,
 31                         text: ‘半年‘
 32                     }, {
 33                         type: ‘year‘,
 34                         count: 1,
 35                         text: ‘一年‘
 36                     }, {
 37                         type: ‘all‘,
 38                         text: ‘全部‘
 39                     }, {
 40                         type: ‘ytd‘,
 41                         text: ‘今天‘
 42                     }
 43                 ],
 44                 enabled : true,
 45                 buttonTheme: {
 46                     width:80,
 47                 },
 48                 selected: 0,
 49                 allButtonsEnabled : false,
 50                 inputDateFormat: ‘%Y-%m-%d‘,
 51                 inputEditDateFormat: ‘%Y-%m-%d‘,
 52             },
 53             legend : {
 54                 enabled: true,
 55                 backgroundColor: ‘#fff‘,
 56                 borderWidth:1,
 57                 layout: ‘vertical‘,
 58                 verticalAlign: ‘center‘,
 59                 x:450,
 60                 y:300
 61             },
 62             xAxis : {
 63                 labels : {
 64                     format : ‘{value:%Y-%m-%d}‘,
 65                     rotation: 30,
 66                     align: ‘left‘,
 67                     style : {
 68                         fontWeight : ‘bold‘,
 69                     }
 70                 },
 71                 title : {
 72                     text : ‘日期‘,
 73                     align: ‘high‘,
 74                 },
 75             },
 76
 77             yAxis : {
 78                 title : {
 79                     text : ‘值(‘+res.y_sign+‘)‘,
 80                     rotation: 0,
 81                     x:10,
 82                     y:-70,
 83                 },
 84                 labels : {
 85                     format : ‘{value}‘,
 86                 },
 87                 alternateGridColor: ‘#FDFFD5‘, //隔区变色
 88                 opposite: true, //y轴位置  left  right
 89                 offset: 50, //y轴与数据区位置
 90             },
 91             tooltip: {
 92                 enabled: true,
 93                 // type: ‘datetime‘,
 94                 // dateTimeLabelFormats:{
 95                 //         day:‘%Y-%m-%d‘
 96                 //         },
 97                 formatter: function() {
 98                     var s = ‘<b>‘ + Highcharts.dateFormat(res.tool_format, this.x) + ‘</b>‘;
 99                     $.each(this.points, function() {
100                         s += ‘<br/>‘ + ‘<tspan  style="fill:‘ + this.series.color + ‘;" x="8" dy="16">●</tspan>‘ + this.series.name + ‘:‘ + this.y;
101                     });
102                     return s;
103                 },
104                 crosshairs: [true, true],                                /*x+y数据标尺*/
105                 crosshairs: {
106                     dashStyle: ‘dash‘,
107                     /*数据 标尺线样式*/
108                     color: ‘red‘,
109                 }
110             },
111              /*下部时间拖拉选择*/
112             navigator: {
113                 enabled: true,
114                 /*关闭时间选择*/
115                 baseseries: 10
116             },
117             /*数据点设置*/
118             plotOptions: {
119                 series: {
120                     marker: {
121                         enabled: true,
122                         /*数据点是否显示*/
123                         radius: 2,
124                         /*数据点大小px*/
125                         fillColor:‘#000‘                                /*数据点颜色*/
126                     },
127                     dataLabels: {
128                         enabled: false,
129                         /*在数据点上显示数值*/
130                         format: ‘{y}‘
131                     },
132                     // enableMouseTracking: false   /*关闭tip层*/
133                 }
134             },
135             scrollbar: {
136                 enabled: true /*关闭下方滚动条*/
137             },
138             series : res.data_obj
139         });
140     },
141     date_format : function(now) {
142         return new Date(now).getTime();
143     },
144     pie_png : function(res) {//饼状图
145         res._this.highcharts({
146             chart: {
147                 plotBackgroundColor: null,
148                 plotBorderWidth: null,
149                 plotShadow: false
150             },
151             title: {
152                 text: res.title,
153             },
154             tooltip: {
155                 pointFormat: ‘{series.name}: <b>{point.percentage:.1f}%</b>‘
156             },
157             plotOptions: {
158                 pie: {
159                     allowPointSelect: true,
160                     cursor: ‘pointer‘,
161                     dataLabels: {
162                         enabled: true,
163                         color: ‘#000000‘,
164                         connectorColor: ‘#000000‘,
165                         format: ‘<b>{point.name}</b>: {point.percentage:.1f} %‘
166                     }
167                 }
168             },
169             credits : {
170                 enabled : false,
171             },
172             series: [{
173                 type: ‘pie‘,
174                 name: res.series_name,
175                 data: res.series_data,
176             }]
177         });
178     }
179 });
调用:
//直接写在tpl模板文件中的,
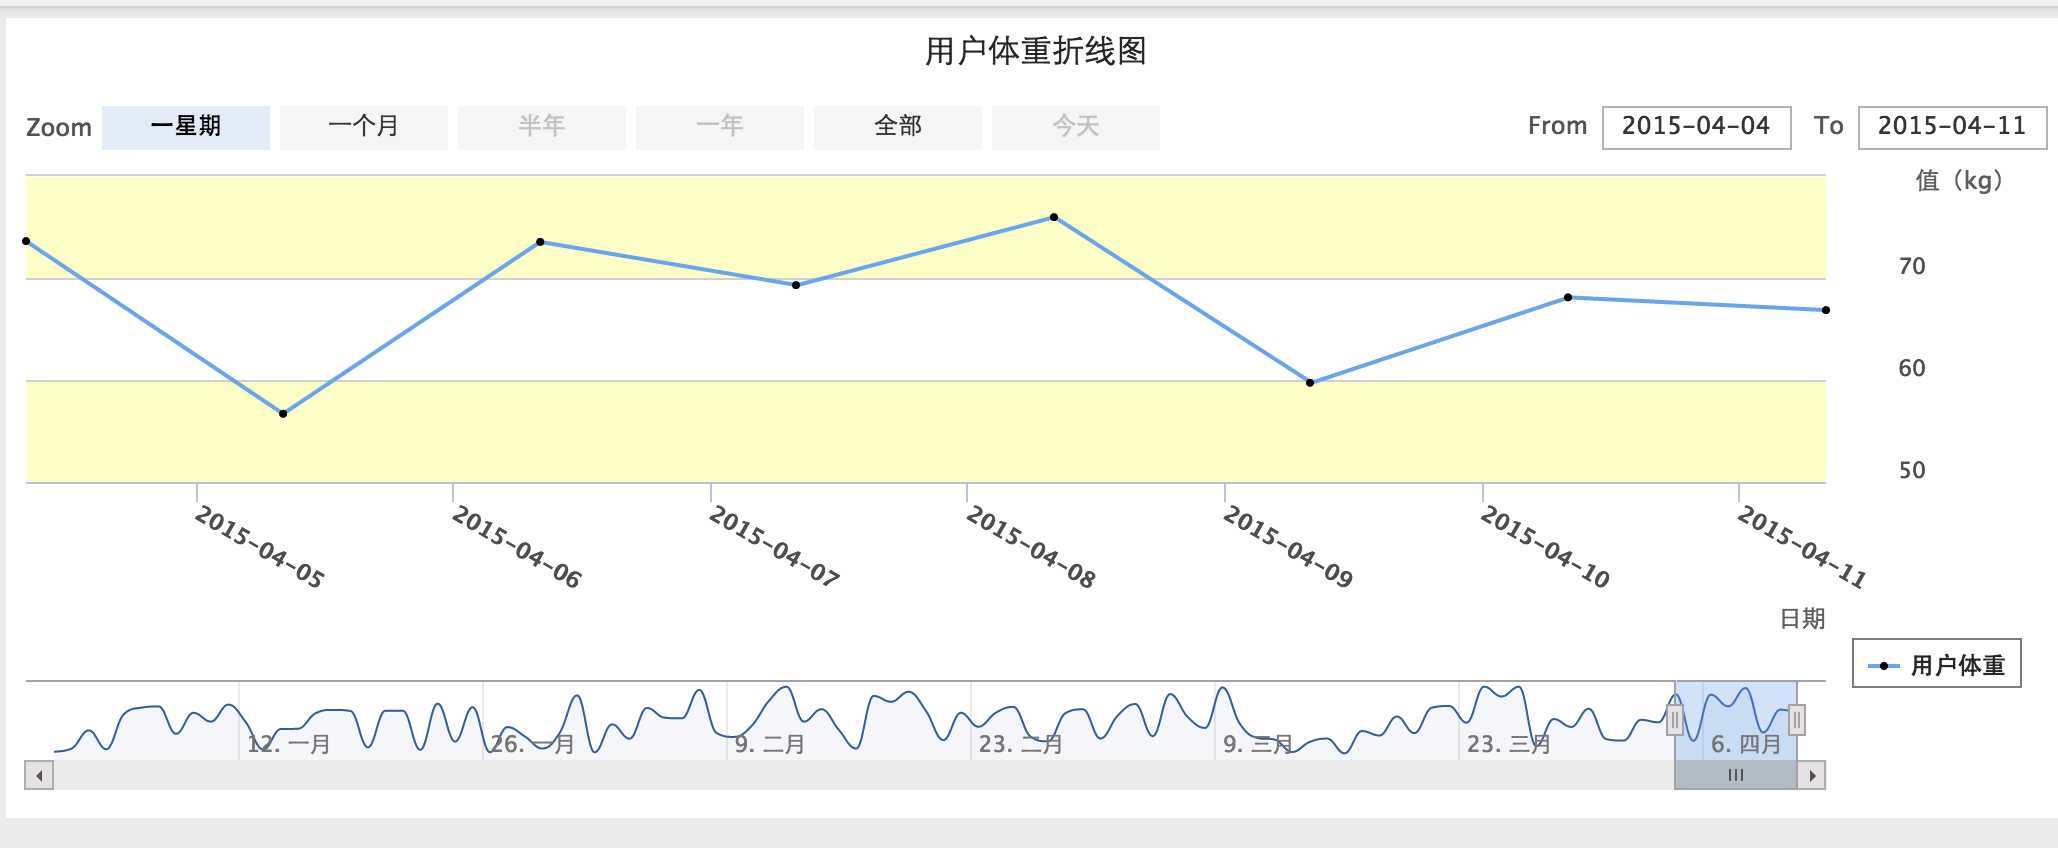
1 <script type="text/javascript"> 2 $(document).ready(function() { 3 var data_arr = []; 4 var arr_temp = []; 5 $.ajax({ 6 url : THINK.URL + ‘/ajaxWeight‘,//THINK.URL 是通过js传值过来的 7 type : ‘get‘, 8 dataType : ‘json‘, 9 data : {‘user_id‘:<?php echo $info[‘user_id‘];?>}, 10 beforeSend : function() { 11 $(‘#table_png‘).html(‘加载数据中...‘); 12 }, 13 success : function(res) { 14 if(res) { 15 $.each(res,function(i,n) { 16 arr_temp = []; 17 arr_temp.push($.date_format(n.weight_date)); 18 arr_temp.push(parseFloat(n.weight)); 19 data_arr.push(arr_temp);
//或者直接 data_arr.push([$.date_format(n.weight_date),parseFloat(n.wieght)]); 20 }); 21 $.table_png({ 22 _this : $(‘#table_png‘), 23 title : ‘用户体重折线图‘, 24 data_obj : [{ 25 name : ‘用户体重‘, 26 data : data_arr, 27 }], 28 y_sign : ‘kg‘, 29 }); 30 }else { 31 $(‘#table_png‘).html(‘没有找到任何数据‘); 32 } 33 } 34 }); 35 }); 36 37 </script>
服务器端:
 1 //ajax用户体重图表数据
 2         public function ajaxWeight() {
 3             $user_id                 = I(‘get.user_id‘,0);
 4
 5             //检查权限
 6             $this->_checkPower($user_id);
 7
 8             $map[‘user_id‘]         = $user_id;
 9             //获取体重详情
10             $user_weight_model         = M(‘user_weight‘);
11             $weight_info             = $user_weight_model->field(‘weight_date,weight‘)->where($map)->order(‘weight_date asc‘)->select();
12             if($weight_info === false)
13                 die(‘error:服务器查询用户体重信息失败‘);
14
15             echo json_encode($weight_info);
16         }
上面的代码实现的效果:
留个笔记,目前能用即可,详情的功能需要再研究
标签:
原文地址:http://www.cnblogs.com/lxdd/p/4344919.html