标签:
首先,利用前面说的如何在ubuntu上安装ipython notebook,
再安装好pygal
我们在浏览器打开notebook,运行下列代码
import pygal
line_chart = pygal.Line()
line_chart.title = ‘Browser usage evolution (in %)‘
line_chart.x_labels = map(str, range(2002, 2013))
line_chart.add(‘Firefox‘, [None, None,    0, 16.6,   25,   31, 36.4, 45.5, 46.3, 42.8, 37.1])
line_chart.add(‘Chrome‘,  [None, None, None, None, None, None,    0,  3.9, 10.8, 23.8, 35.3])
line_chart.add(‘IE‘,      [85.8, 84.6, 84.7, 74.5,   66, 58.6, 54.7, 44.8, 36.2, 26.6, 20.1])
line_chart.add(‘Others‘,  [14.2, 15.4, 15.3,  8.9,    9, 10.4,  8.9,  5.8,  6.7,  6.8,  7.5])
line_chart.render()
会发现无法出图啊啊啊啊!!!

怎么办呢?
下面输入以下代码
%matplotlib inline
from IPython.display import SVG, HTML
html_pygal = """
<!DOCTYPE html>
<html>
  <head>
  <script type="text/javascript" src="http://kozea.github.com/pygal.js/javascripts/svg.jquery.js"></script>
  <script type="text/javascript" src="http://kozea.github.com/pygal.js/javascripts/pygal-tooltips.js"></script>
    <!-- ... -->
  </head>
  <body>
    <figure>
      {pygal_render}
    </figure>
  </body>
</html>
"""
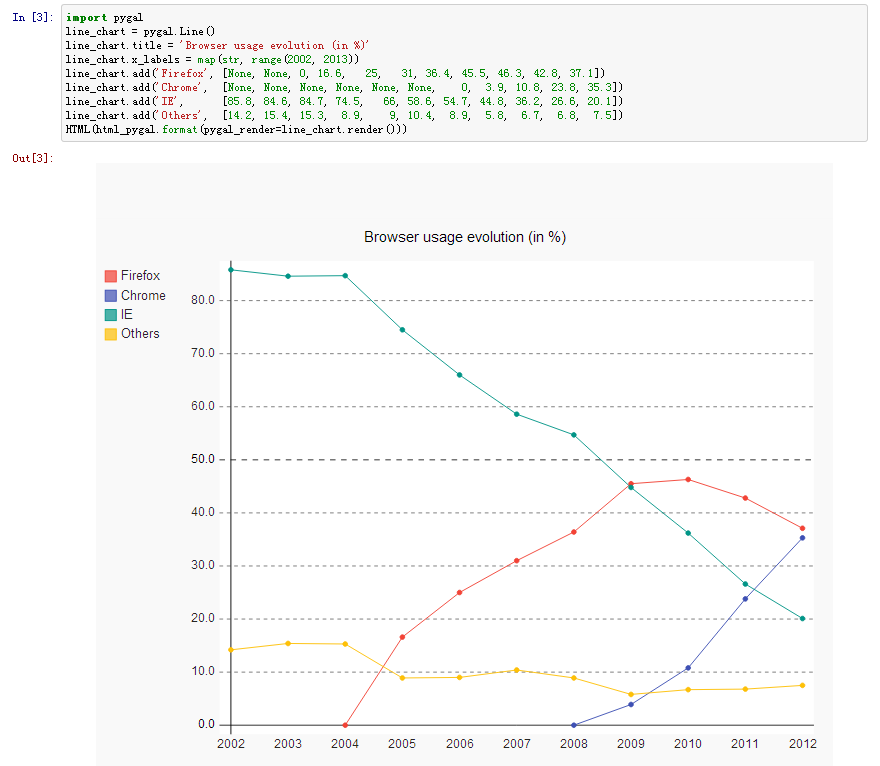
稍微修改下上面的代码,让他返回到html里
import pygal
line_chart = pygal.Line()
line_chart.title = ‘Browser usage evolution (in %)‘
line_chart.x_labels = map(str, range(2002, 2013))
line_chart.add(‘Firefox‘, [None, None, 0, 16.6,   25,   31, 36.4, 45.5, 46.3, 42.8, 37.1])
line_chart.add(‘Chrome‘,  [None, None, None, None, None, None,    0,  3.9, 10.8, 23.8, 35.3])
line_chart.add(‘IE‘,      [85.8, 84.6, 84.7, 74.5,   66, 58.6, 54.7, 44.8, 36.2, 26.6, 20.1])
line_chart.add(‘Others‘,  [14.2, 15.4, 15.3,  8.9,    9, 10.4,  8.9,  5.8,  6.7,  6.8,  7.5])
HTML(html_pygal.format(pygal_render=line_chart.render()))
标签:
原文地址:http://my.oschina.net/jastme/blog/491526