标签:
原文地址:http://blog.csdn.net/caryee89/article/details/6935237
注意android2.3以后才可用,主要用到这个类Visualizer,这个源码其实是apiDemos中一个例子,但例子中实现的是两种中的波形显示,而不是频谱显示,
原文博主实现了另一种频谱显示,并分享出来,精神可嘉。我做了些修改,使稍微好看了些,继续分享。
官方文档解释:
Returns a frequency capture of currently playing audio content.
This method must be called when the Visualizer is enabled.
The capture is an 8-bit magnitude FFT, the frequency range covered being 0 (DC) to half of the sampling rate returned by getSamplingRate(). The capture returns the real and imaginary parts of a number of frequency points equal to half of the capture size plus one.
Note: only the real part is returned for the first point (DC) and the last point (sampling frequency / 2).
The layout in the returned byte array is as follows:
| Index
|
0
|
1
|
2
|
3
|
4
|
5
|
...
|
n - 2
|
n - 1
|
| Data
|
Rf0
|
Rf(n/2)
|
Rf1
|
If1
|
Rf2
|
If2
|
...
|
Rf(n-1)/2
|
If(n-1)/2
|
SUCCESS in case of success, ERROR_NO_MEMORY, ERROR_INVALID_OPERATION or ERROR_DEAD_OBJECT in case of failure.| IllegalStateException |
|---|
实部和虚部的平方和就是振幅的平方,因为是byte类型,所以最大值是127。
对原文的代码做了一些修改,使更好看一些,代码中用到的歌曲谁要用到,自己重新放一首就行,代码如下:
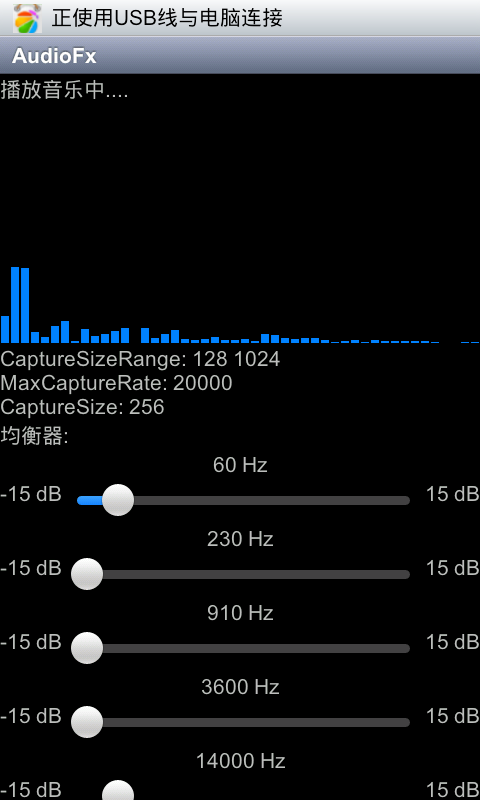
运行效果如下:

标签:
原文地址:http://www.cnblogs.com/Free-Thinker/p/4746082.html