标签:style blog http java color 使用

  1 <!DOCTYPE html>
  2 <html>
  3 <head>
  4     <title>PlanStatistics</title>
  5     <script type="text/javascript" src="@Url.Content("~/js/jquery-1.7.1.min.js")"></script>
  6     <script type="text/javascript" src="@Url.Content("~/Js/HighChart/highcharts.js")"></script>
  7     <style type="text/css" lang="cs">
  8         .butButton
  9         {
 10             border: 0;
 11             padding: 0 23px;
 12             height: 26px;
 13             line-height: 26px;
 14             cursor: pointer;
 15             background: #2F7ED8;
 16             font-size: 14px;
 17             color: white;
 18             text-shadow: 0 0 1px #358DBE;
 19         }
 20         .butButton:hover
 21         {
 22             background: #4897F1;
 23         }
 24         .searchText
 25         {
 26             height: 24px;
 27             line-height: 24px;
 28             width: 220px;
 29             border: 1px solid #B8C5C9;
 30         }
 31         input, textarea, select
 32         {
 33             font-family: "Microsoft Yahei" , "微软雅黑" , Arial;
 34             font-weight: inherit;
 35             font-size: 100%;
 36         }
 37     </style>
 38     <script type="text/javascript">
 39         $(function () {
 40             var groupId = "@ViewBag.GroupId";
 41             var teacherId = "@ViewBag.TeacherId";
 42             var startDate = "@ViewBag.StartDate";
 43             var endDate = "@ViewBag.EndDate";
 44             var datas = { GroupId: groupId, TeacherId: teacherId, StartDate: startDate, EndDate: endDate };
 45             var urlc = ‘@Url.Content("~/Reports/GetReportDatas")‘;
 46             $.ajax({
 47                 type: "POST",
 48                 url: urlc,
 49                 data: datas,
 50                 success: function (msg) {
 51                     var colors = msg.split(‘&&‘)[0];
 52                     var reportData = msg.split(‘&&‘)[1];
 53                     if (reportData.length > 0) {
 54                         $("#container").text("");
 55                         LoadReport(reportData, colors);
 56                     }
 57                     else {
 58                         $("#container").text("");
 59                         $("#container").append(‘<div style="text-align: center; margin-top:200px;"><b>无可用数据</b></div>‘);
 60                     }
 61                 }
 62             });
 63         })
 64         function LoadReport(reportData, typeColor) {
 65             chart = new Highcharts.Chart({
 66                 chart: {
 67                     renderTo: ‘container‘
 68                 },
 69                 colors: eval(typeColor),
 70                 title: {
 71                     text: ‘教师任务量统计报表‘
 72                 },
 73                 plotArea: {
 74                     shadow: null,
 75                     borderWidth: null,
 76                     backgroundColor: null
 77                 },
 78                 tooltip: {
 79                     formatter: function () {
 80                         return ‘<b>任务类型:</b>‘ + this.point.name + ‘<br/>‘ + "<b>百分比:</b>" + Highcharts.numberFormat(this.percentage, 1) + ‘%<br/><b>天数:</b>‘ +
 81                          Highcharts.numberFormat(this.y, 0, ‘,‘) + ‘ 天‘;
 82                     }
 83                 },
 84                 plotOptions: {
 85                     pie: {
 86                         allowPointSelect: true,
 87                         cursor: ‘pointer‘,
 88                         dataLabels: {
 89                             enabled: true,
 90                             formatter: function () {
 91                                 if (this.percentage > 4) return this.point.name;
 92                             },
 93                             color: ‘black‘,
 94                             style: {
 95                                 font: ‘13px Trebuchet MS, Verdana, sans-serif‘
 96                             }
 97                         }
 98                     }
 99                 },
100                 legend: {
101                     backgroundColor: ‘#FFFFFF‘,
102                     x: 0,
103                     y: -30
104                 },
105                 credits: {
106                     enabled: false
107                 },
108                 series: [{
109                     type: ‘pie‘,
110                     name: ‘Browser share‘,
111                     data: eval(reportData)
112                 }]
113             });
114         }
115     </script>
116 </head>
117 <body>
118     <div id="container" style="min-width: 700px; height: 400px; margin-top: 20px;">
119     </div>
120 </body>
121 </html>
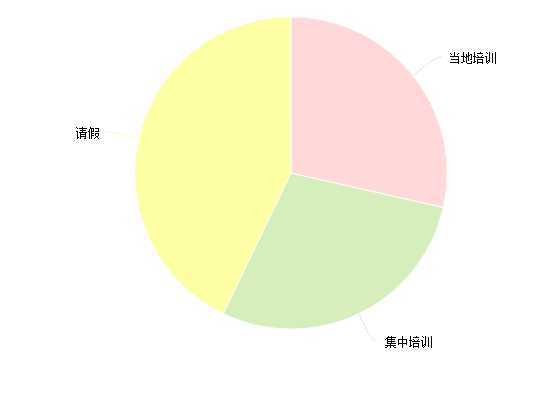
饼行效果图:

HighCharts 详细使用及API文档说明:
http://www.cnblogs.com/meitangdekafei/p/3768178.html
Highcharts中文教程:
http://www.hcharts.cn/docs/index.php
类似w3school网站,开源代码,各种图形都有:
标签:style blog http java color 使用
原文地址:http://www.cnblogs.com/sunny0515/p/3850554.html