标签:

clc,clear;

fm = 500; % 调制信号频率(Hz)
Am = 0.5; % 调制信号幅度
fc = 5e3; % 载波频率(Hz)
Ac = 1; % 载波幅度
mf = 5; % 调频指数


%%
%firstly
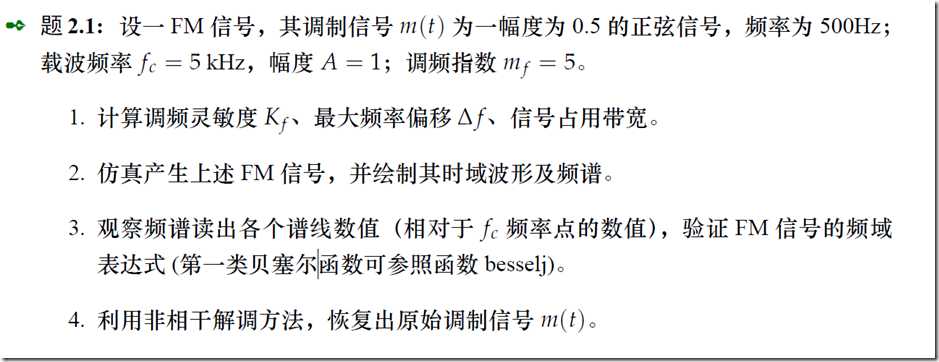
kf = mf * 2 * pi * fm / Am
diatf = kf * Am
B = 2 * (mf + 1) * fm

%%
%secondly
fs = 64e3; % 采样率
N = 3000; % 样点总数
t = (0:N-1)‘/fs; % 时间t

%绘制时域波形
m_t = Am*sin(2*pi*fm*t); % 调制信号
phi_t = kf*cumsum(m_t)/fs; % 相位积分
s_t = cos(2*pi*fc*t + phi_t); % 已调信号figure(1)
subplot(1,3,1)
plot(t, s_t , ‘b‘); % 绘波形
xlabel(‘time‘);
ylabel(‘amplitude‘);
title(‘时域波形‘);

%绘制功率谱
L = length(s_t);               % 取得序列长度
u = fftshift(fft(s_t ));       % 离散傅里叶变换,求频谱
u_pow = pow2db(abs(u).^2);     % 幅度转为dB
w = (0:L-1)‘*fs/L - 1/2*fs;    % 横坐标-频率

subplot(1,3,2);
plot(w, u_pow);
grid on;
xlabel(‘frequency(Hz)‘);
ylabel(‘magnitude(dB)‘);
title(‘功率谱‘);


%%
%fortly

[lpf_b,lpf_a] = butter(3, (fc/5)/(fs/2)); % 设计低通滤波器
t = (0:N-1)‘/fs; % 时间t
r_t = s_t;
subplot(1,3,3)
r_d_t = [0;diff(r_t)]; % 求微分
r_e_t = abs(r_d_t); % 包络检波
demod_t = filter(lpf_b, lpf_a, r_e_t); % 滤波
plot(t, demod_t , ‘b‘); % 绘图
title(‘解调波形‘);


%%
%thirdly
fs_J=100e3;
t=(0:N-1)‘;
N_J=3000000;
t_J=(0:N_J-1)‘;

sm=Am*cos(2*pi*fm/fs*t);
sfm_J=Ac*cos(2*pi*fc/fs_J*t_J+mf*sin(2*pi*fm/fs_J*t_J));

Sfm=fft(sfm_J);
figure;
plot(abs(Sfm));

i=0:9
J=besselj(i,mf);
J_comp=abs(J/J(1))
在进行功率谱分析的时候,可以将采样点增大,而绘图的采样点不变,这样子得到的功率谱会更加离散,便于和贝塞尔函数进行比较。
clear all;clc;

%载入信号
load(‘fm_cap.mat‘);
fm_cap = resample(fm_cap,1,4);  %降低采样率

fs = 500e3;                % 采样率
N = length(fm_cap);        % 样点数
t = (0:N-1)‘/fs;           % 时间t

r_d_t = [0;diff(fm_cap)];  % 求微分
r_e_t = abs(hilbert(r_d_t));
r_e_t = r_e_t - sum(r_e_t)/N;


plot(t, r_e_t , ‘b‘);      % 绘图
[lpf_b,lpf_a] = butter(5, 10e3/(fs/2)); % 设计低通滤波器
demod_t = filter(lpf_b, lpf_a, r_e_t); % 滤波

demod_t = resample(demod_t,16,125);
demod_t = demod_t ./ max(demod_t);
sound(demod_t,64e3);
标签:
原文地址:http://www.cnblogs.com/BlueMountain-HaggenDazs/p/4886890.html